> ## Documentation Index
> Fetch the complete documentation index at: https://docs.dash360.com/llms.txt
> Use this file to discover all available pages before exploring further.
# Building a Flat Data Grid
> Step-by-step guide to building a Flat Data Grid report, every display option, performance tips, and pitfalls to avoid.
# Building a Flat Data Grid
A Flat Data Grid is a tabular report: rows and columns, with grouping, sorting, filtering, and totals. Use it when people need to see detailed rows or export raw data to Excel.
This page is part of the [Report Studio](/user-guide/reporting/report-designer) guide. For choosing fields and building formulas, see [Fields and Calculated Fields](/user-guide/reporting/report-designer-fields).
## Build it
On the landing page, click **Create New Report** and choose **Flat Data Grid**.
Select one or more project snapshots. You can combine snapshots from several projects.
Add columns one of two ways:
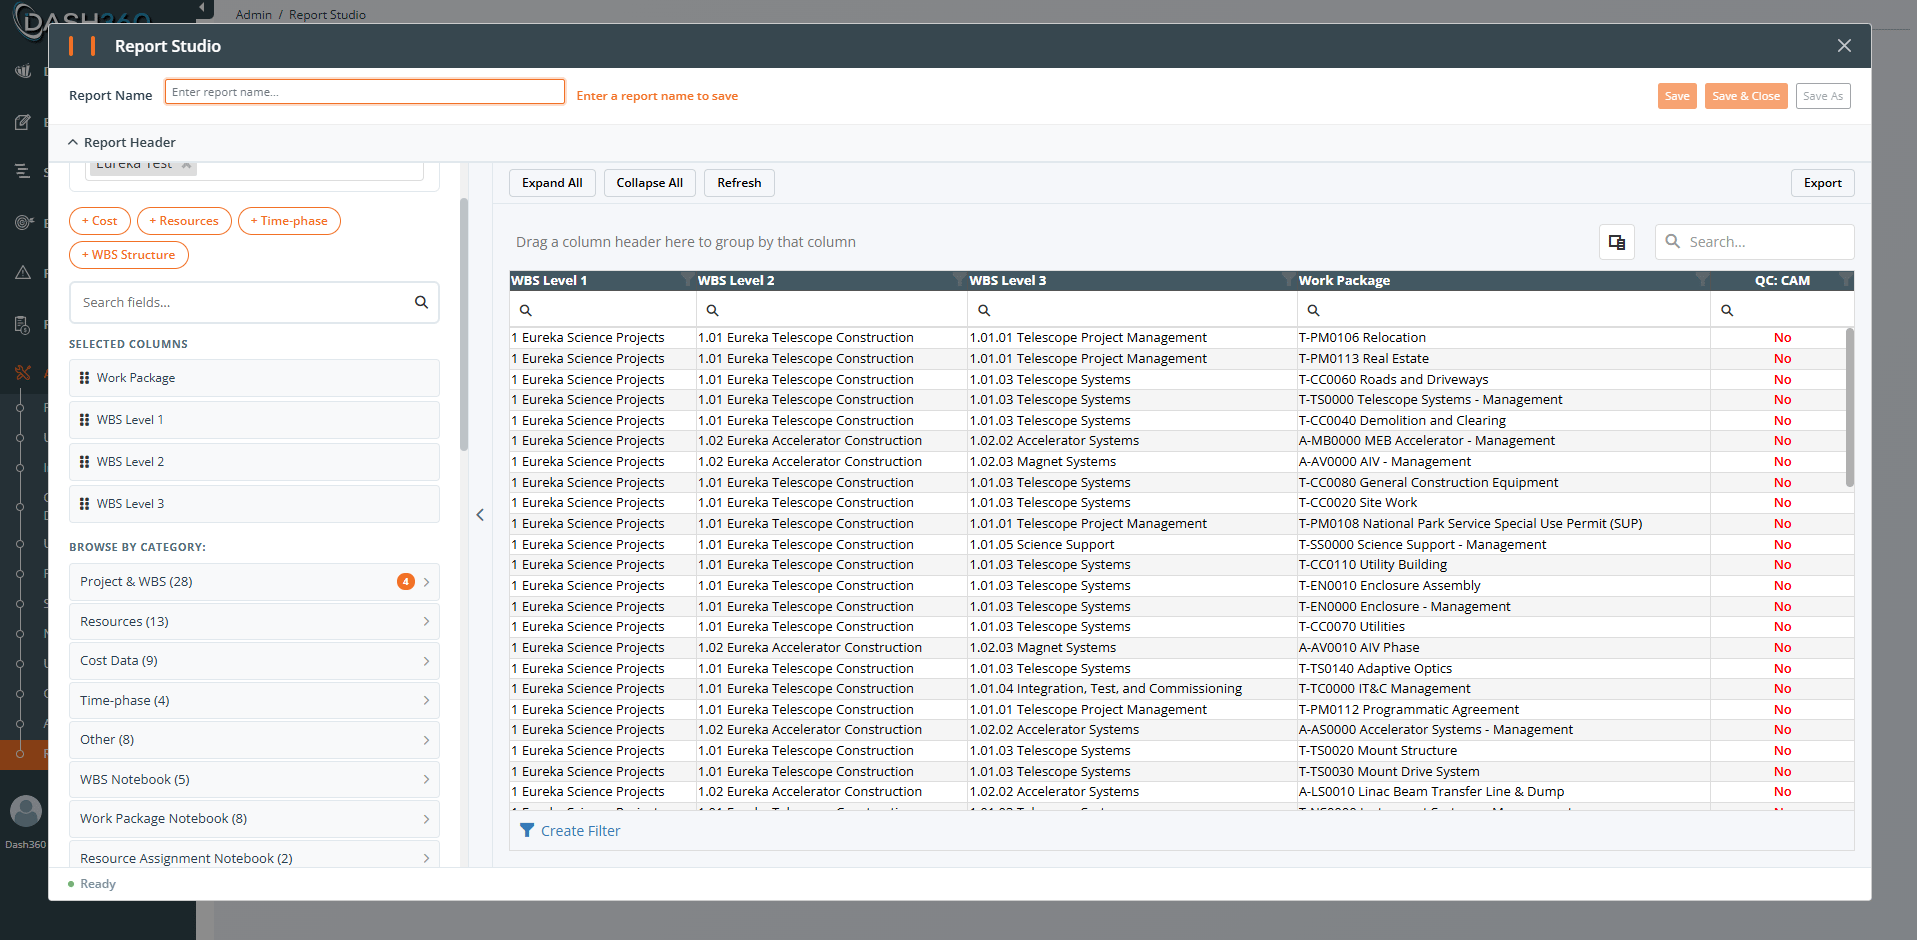
* **Quick-Add buttons** add a whole category at once: **+ Cost**, **+ Resources**, **+ Time-phase**, **+ WBS Structure**.
* **Browse by category** and check individual columns.
Added columns appear in the **Selected Columns** panel.
In the Selected Columns panel, drag columns to reorder them. For each column you can:
* Click the gear icon to **Edit caption** (change the display name; the data is unchanged).
* Click the undo icon to **Reset caption** back to the default.
* Click the X icon to **Remove column**.
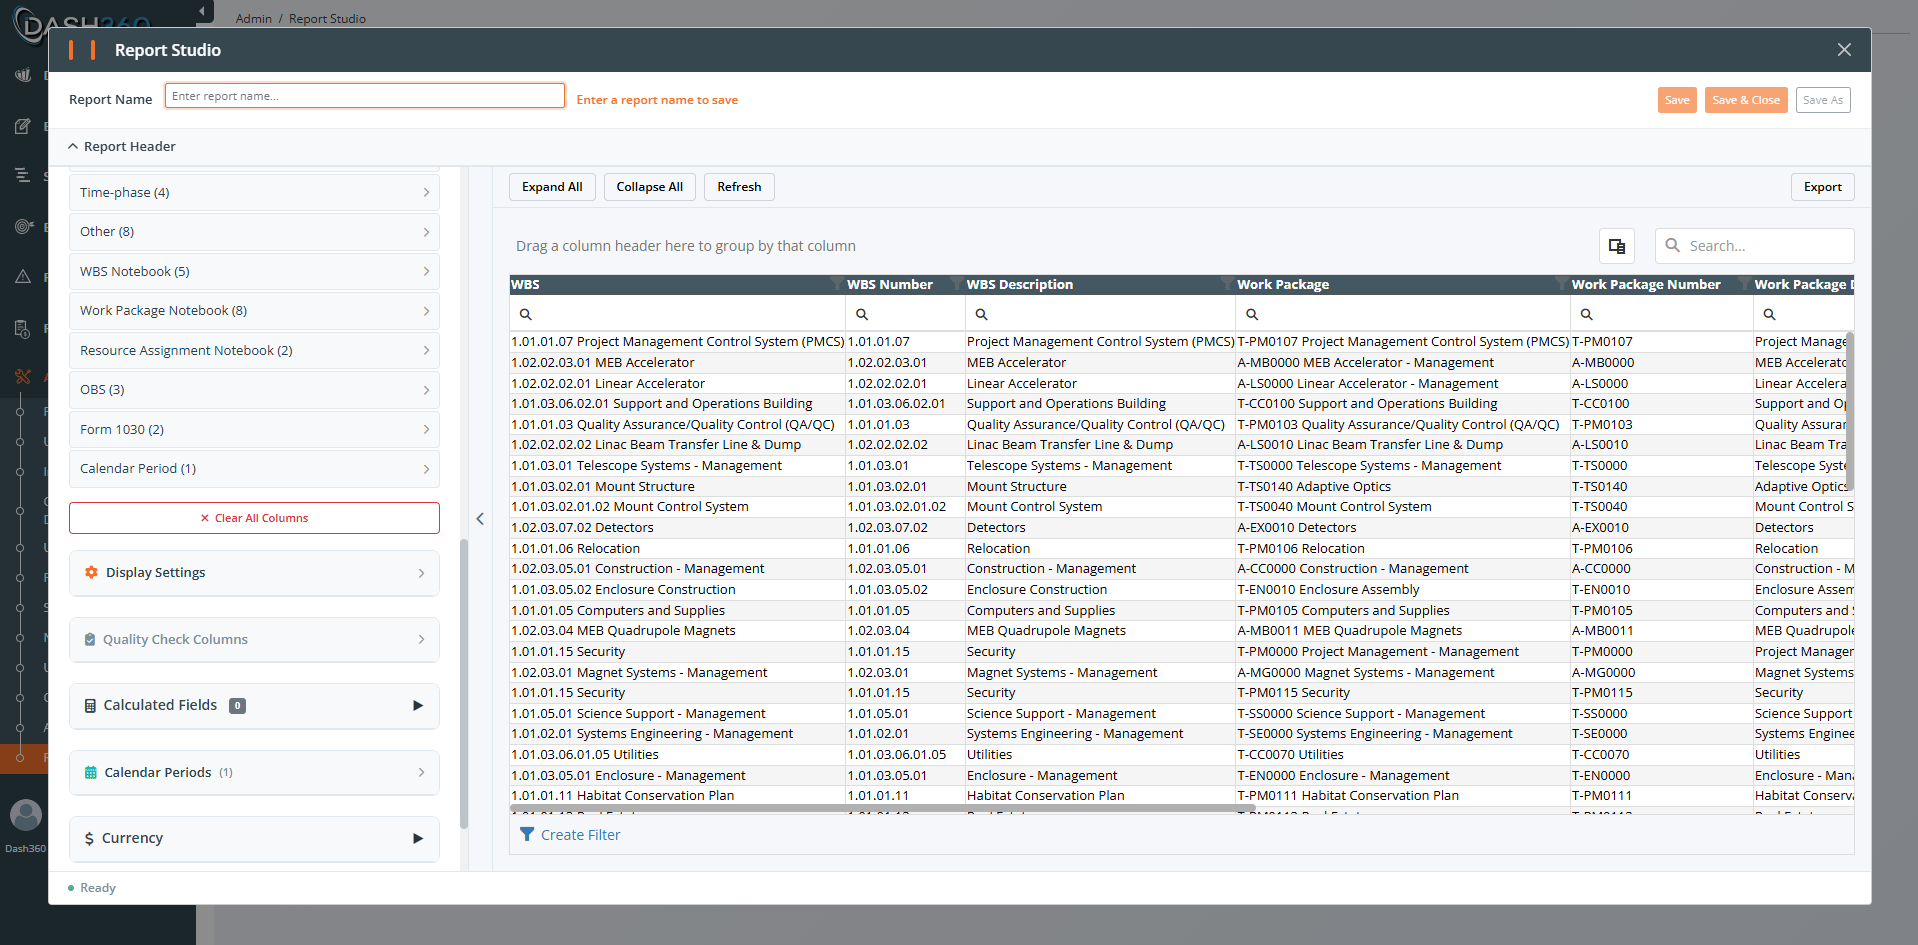
Open **Display Settings** and set the toggles (see the table below).
Add Yes/No columns that check whether a field is empty or missing, useful for data-quality audits. See [Quality Check columns](#quality-check-columns).
Add a title, subtitle, and description, then click **Save**.
 ## Display settings
| Setting | What it does | Default |
| -------------------- | ---------------------------------------------------------------------------------------- | ------- |
| **Alternating Rows** | Zebra striping for readability | On |
| **Word Wrap** | Wrap long cell text instead of cutting it off | Off |
| **Filter Row** | A row of search boxes under the column headers | On |
| **Column Fixing** | Let users pin columns to the left or right edge | Off |
| **Group Row Prefix** | Show the field name before the value in grouped rows (for example, "WBS Level 1: value") | Off |
| **Summary Footer** | Show the Total row at the bottom | On |
### Fiscal Year prefix
Dash360 detects whether your selected projects use fiscal or calendar years. When all selected projects are the same, the prefix is applied automatically and an information row tells you so. When you mix fiscal-year and calendar-year projects, a **Show Fiscal Year Prefix** toggle appears so you can decide.
## Totals and summaries
* The **Summary Footer** toggle controls the grand-total row at the bottom.
* Column totals appear for numeric cost columns the report displays (for example, Item Cost, Contingency, Unit Cost, Units).
* Calculated fields can also produce totals. See [Fields and Calculated Fields](/user-guide/reporting/report-designer-fields).
## Quality Check columns
Quality Check columns turn a field into a simple **Yes/No** answer to "does this row have a value here?"
* Open the **Quality Check Columns** section and pick the fields to check.
* Each one becomes a column captioned `QC: {Field}` by default; you can edit the caption.
* Use **Clear All QC Columns** to remove them all at once.
These are ideal for completeness audits, for example "which work packages are missing a Basis of Estimate."
## Display settings
| Setting | What it does | Default |
| -------------------- | ---------------------------------------------------------------------------------------- | ------- |
| **Alternating Rows** | Zebra striping for readability | On |
| **Word Wrap** | Wrap long cell text instead of cutting it off | Off |
| **Filter Row** | A row of search boxes under the column headers | On |
| **Column Fixing** | Let users pin columns to the left or right edge | Off |
| **Group Row Prefix** | Show the field name before the value in grouped rows (for example, "WBS Level 1: value") | Off |
| **Summary Footer** | Show the Total row at the bottom | On |
### Fiscal Year prefix
Dash360 detects whether your selected projects use fiscal or calendar years. When all selected projects are the same, the prefix is applied automatically and an information row tells you so. When you mix fiscal-year and calendar-year projects, a **Show Fiscal Year Prefix** toggle appears so you can decide.
## Totals and summaries
* The **Summary Footer** toggle controls the grand-total row at the bottom.
* Column totals appear for numeric cost columns the report displays (for example, Item Cost, Contingency, Unit Cost, Units).
* Calculated fields can also produce totals. See [Fields and Calculated Fields](/user-guide/reporting/report-designer-fields).
## Quality Check columns
Quality Check columns turn a field into a simple **Yes/No** answer to "does this row have a value here?"
* Open the **Quality Check Columns** section and pick the fields to check.
* Each one becomes a column captioned `QC: {Field}` by default; you can edit the caption.
* Use **Clear All QC Columns** to remove them all at once.
These are ideal for completeness audits, for example "which work packages are missing a Basis of Estimate."
 ## Performance: apply filters early
A Flat Data Grid runs entirely on the server (the server does the paging, sorting, filtering, and totals, then sends back only what the grid needs). The single biggest thing you can do for responsiveness is **reduce the number of rows the report has to work with**:
**Filter first, then explore.** Before you sort, group, or scroll a large report, apply filters (project, WBS, Work Package, Cost Class, Resource Type) so the server works with fewer rows. A report narrowed to one WBS branch responds far faster than the whole project.
* **Select only the projects you need.** Every extra snapshot adds rows.
* **Add only the columns you need.** Fewer columns means less data per row.
* **Group and expand on demand** rather than expanding everything at once on a huge dataset.
* **Results are cached for up to 30 minutes**, so re-running the same report with the same filters is fast. Changing filters or projects runs a fresh query.
## Pitfalls to avoid
* **Too many projects or no filters on a large project.** The grid still works, but it will feel slow. Narrow the scope first.
* **Turning off Summary Footer when users expect totals.** If users rely on the grand total, leave it on.
* **Renaming a column caption and assuming the underlying field changed.** Captions are display-only; calculated fields and exports still use the real field name.
* **Expecting a saved view to remember filters.** Views remember layout (columns, order, grouping, sorting), not filters. See [Report Gallery](/user-guide/reporting/reports-viewer).
## Where to go next
Cross-tab analysis with drag-and-drop zones.
Snapshots, filters, permissions, and caching.
## Performance: apply filters early
A Flat Data Grid runs entirely on the server (the server does the paging, sorting, filtering, and totals, then sends back only what the grid needs). The single biggest thing you can do for responsiveness is **reduce the number of rows the report has to work with**:
**Filter first, then explore.** Before you sort, group, or scroll a large report, apply filters (project, WBS, Work Package, Cost Class, Resource Type) so the server works with fewer rows. A report narrowed to one WBS branch responds far faster than the whole project.
* **Select only the projects you need.** Every extra snapshot adds rows.
* **Add only the columns you need.** Fewer columns means less data per row.
* **Group and expand on demand** rather than expanding everything at once on a huge dataset.
* **Results are cached for up to 30 minutes**, so re-running the same report with the same filters is fast. Changing filters or projects runs a fresh query.
## Pitfalls to avoid
* **Too many projects or no filters on a large project.** The grid still works, but it will feel slow. Narrow the scope first.
* **Turning off Summary Footer when users expect totals.** If users rely on the grand total, leave it on.
* **Renaming a column caption and assuming the underlying field changed.** Captions are display-only; calculated fields and exports still use the real field name.
* **Expecting a saved view to remember filters.** Views remember layout (columns, order, grouping, sorting), not filters. See [Report Gallery](/user-guide/reporting/reports-viewer).
## Where to go next
Cross-tab analysis with drag-and-drop zones.
Snapshots, filters, permissions, and caching.