> ## Documentation Index
> Fetch the complete documentation index at: https://docs.dash360.com/llms.txt
> Use this file to discover all available pages before exploring further.
# Fields and Calculated Fields
> Choose base and dynamic fields, build calculated fields including Budget vs Actual, and reuse formulas with the shared library.
# Fields and Calculated Fields
Every report is built from fields. This page explains the kinds of fields available in Report Studio, how to add them, and how to create your own calculated fields with formulas.
This page is part of the [Report Studio](/user-guide/reporting/report-designer) guide.
## Adding fields
How you add fields depends on the report type:
* **Pivot Grid**: Drag fields from the field list into one of four zones: **Rows**, **Columns**, **Data**, or **Filter**. The same field can be moved between zones at any time.
* **Flat Data Grid**: Use the column chooser to check the columns you want. Quick-Add buttons let you add a whole category at once (Cost, Resources, Time, or WBS Structure). Reorder columns by dragging.
* **Charts**: A short setup picks the grouping field, the value type, and which values to show.
Use the search box at the top of the field list to find a field fast. You can also rename any field for display (the original data is unchanged) by editing its caption.
## Base fields
Base fields come straight from the project cost data. Common ones include:
| Category | Examples |
| ----------------- | ---------------------------------------------------------------- |
| **Project / WBS** | WBS, Work Package, Work Package Title |
| **Cost** | Item Cost, Unit Cost, Units, Contingency |
| **Resources** | Resource Type (Labor, Non-Labor, Travel), Cost Class, Cost Basis |
| **Time** | Fiscal Year, Quarter, Month, Start Date, Finish Date |
| **Earned value** | EVT, Percent Complete, CAM |
**Cost Class** is the field that separates Budget, Actual, and Earned values. It appears as a normal field you can group, filter, or pivot on. See [Budget vs Actual](#recipe-budget-vs-actual) below for how to turn those rows into side-by-side columns.
## Dynamic fields
Beyond the base fields, the Designer exposes hundreds of project-specific fields that are defined by your data. These appear automatically based on the snapshots you selected:
* **Notebooks**: WBS, Work Package, and Resource Assignment notebook categories
* **Resource codes and code codes**: Your project's coding structures
* **OBS**: Organizational Breakdown Structure
* **Calendar periods**: Custom reporting calendars (see below)
* **Form 1030**: Government cost-category mapping
Because dynamic fields come from the project, two projects can expose different dynamic fields. If you add fields that only exist in some of your selected snapshots, the Designer warns you.
### Calendar periods
If your projects use custom reporting calendars, those periods are available as fields. Each calendar fills one of up to ten slots, and you can label periods that fall outside the defined ranges as "Unassigned" with a label you choose.
## Calculated fields
Calculated fields are columns you create from a formula. They let you derive values that are not stored directly, such as a variance, a percentage, or a performance index.
An older help article described calculated fields as arithmetic-only. The current Designer supports much more: conditional logic, text, date, and math functions, and aggregate functions. The sections below reflect the current capabilities.
### Two kinds of calculated field
There are two kinds, and the Designer detects which one you have built from the formula:
| Kind | What it does | Example |
| ------------- | ----------------------------------------------------------------------------- | -------------------------------------------- |
| **Row-level** | Calculates a value for each individual row | `IF([CostClass]='Budget', [ItemCost], NULL)` |
| **Aggregate** | Calculates a value across a group or total using SUM, AVG, COUNT, MIN, or MAX | `SUM([BudgetCost]) - SUM([ActualCost])` |
A formula that contains `SUM`, `AVG`, `COUNT`, `MIN`, or `MAX` is treated as an aggregate; everything else is row-level.
### Creating a calculated field
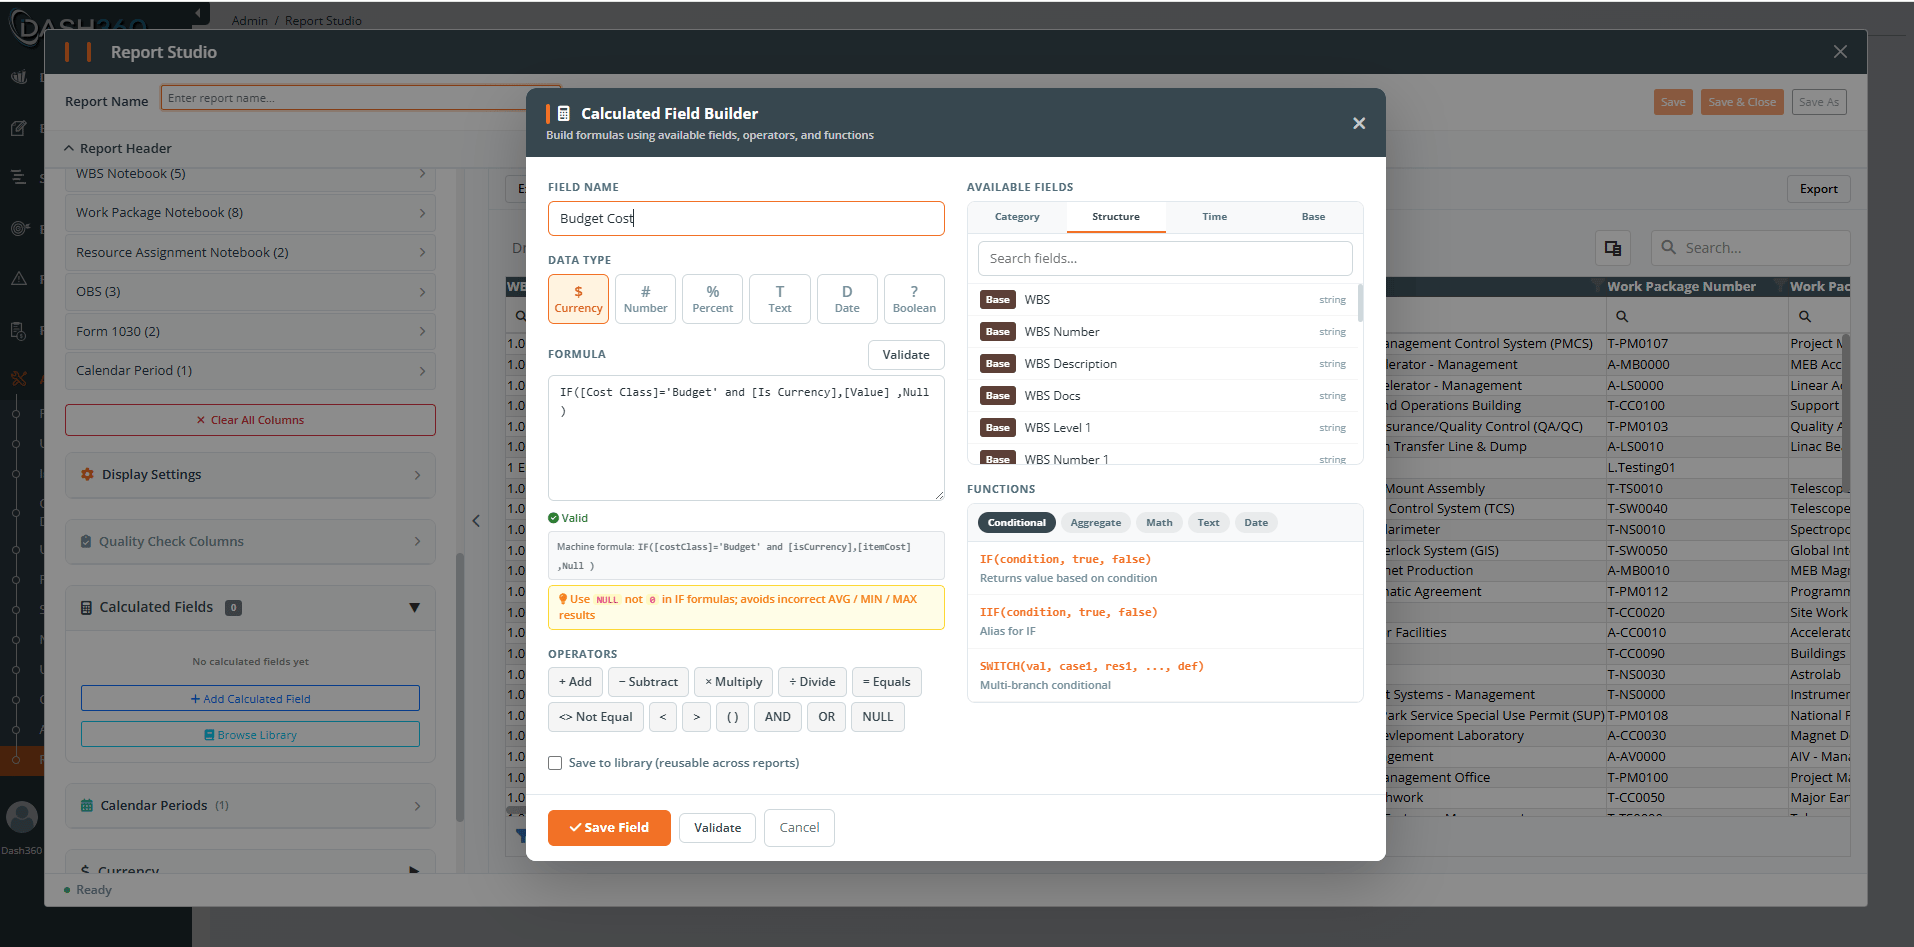
While building a report, open the **Calculated Fields** section and click to add a new field.
Give the field a clear, descriptive name (for example, "Cost Variance"). Names must be unique within the report.
Click field names to insert them as `[Field Name]`, and add operators and functions. Use parentheses to control the order of calculation.
The Designer validates as you type. A green check means the formula is valid; a red icon shows a syntax error or an unknown field; a warning flags possible issues such as division by zero.
Review the live preview on sample data, then save. The field becomes available as a column or chart value, marked with a calculator icon. Hover the column header in the Viewer to see the formula.
 ### Formula syntax
**Field references**: Wrap field names in square brackets, for example `[Item Cost]`. Insert them from the field list to avoid typos.
**Operators**: `+` `-` `*` (or `×`) `/` (or `÷`) `=` `<>` `<` `>` along with `AND`, `OR`, and `NOT`.
**Functions** available include:
| Group | Functions |
| ----------------- | ---------------------------------------------------------------------------------- |
| **Conditional** | `IF` (also `IIF`), `SWITCH` |
| **Aggregate** | `SUM`, `AVG`, `COUNT`, `MIN`, `MAX` |
| **Math** | `ROUND`, `ABS`, `CEILING`, `FLOOR`, `SQRT`, `POWER` |
| **Null handling** | `ISNULL`, `COALESCE` |
| **Date** | `YEAR`, `MONTH`, `DAY`, `DATEDIFF`, `DATEADD`, `TODAY`, `NOW` |
| **Text** | `CONCAT`, `UPPER`, `LOWER`, `TRIM`, `LEN`, `LEFT`, `RIGHT`, `SUBSTRING`, `REPLACE` |
In `IF` formulas that split values, use `NULL` for the "else" result, not `0`. Returning `0` adds ghost zeros that distort averages, minimums, and maximums.
### Recipe: Budget vs Actual
A common need is to show Budget and Actual as separate columns and then compare them. Because Cost Class arrives as separate rows (one Budget row, one Actual row), you split it with row-level formulas and then combine with aggregate formulas.
**Step 1: row-level fields** (one value per row)
```
BudgetCost = IF([CostClass]='Budget', [ItemCost], NULL)
ActualCost = IF([CostClass]='Actual', [ItemCost], NULL)
```
**Step 2: aggregate fields** (across each group and the totals)
```
CostVariance = SUM([BudgetCost]) - SUM([ActualCost])
CPI = SUM([EarnedCost]) / SUM([ActualCost])
```
The Designer resolves dependencies automatically, so `BudgetCost` is calculated before `CostVariance` uses it.
### Dependencies and limits
* Calculated fields can reference other calculated fields, creating a chain. The Designer evaluates them in the correct order.
* **Circular references are not allowed** (Field A references Field B, and Field B references Field A). The Designer blocks them.
* You cannot delete a calculated field that another field depends on; remove or update the dependent field first.
## The shared library
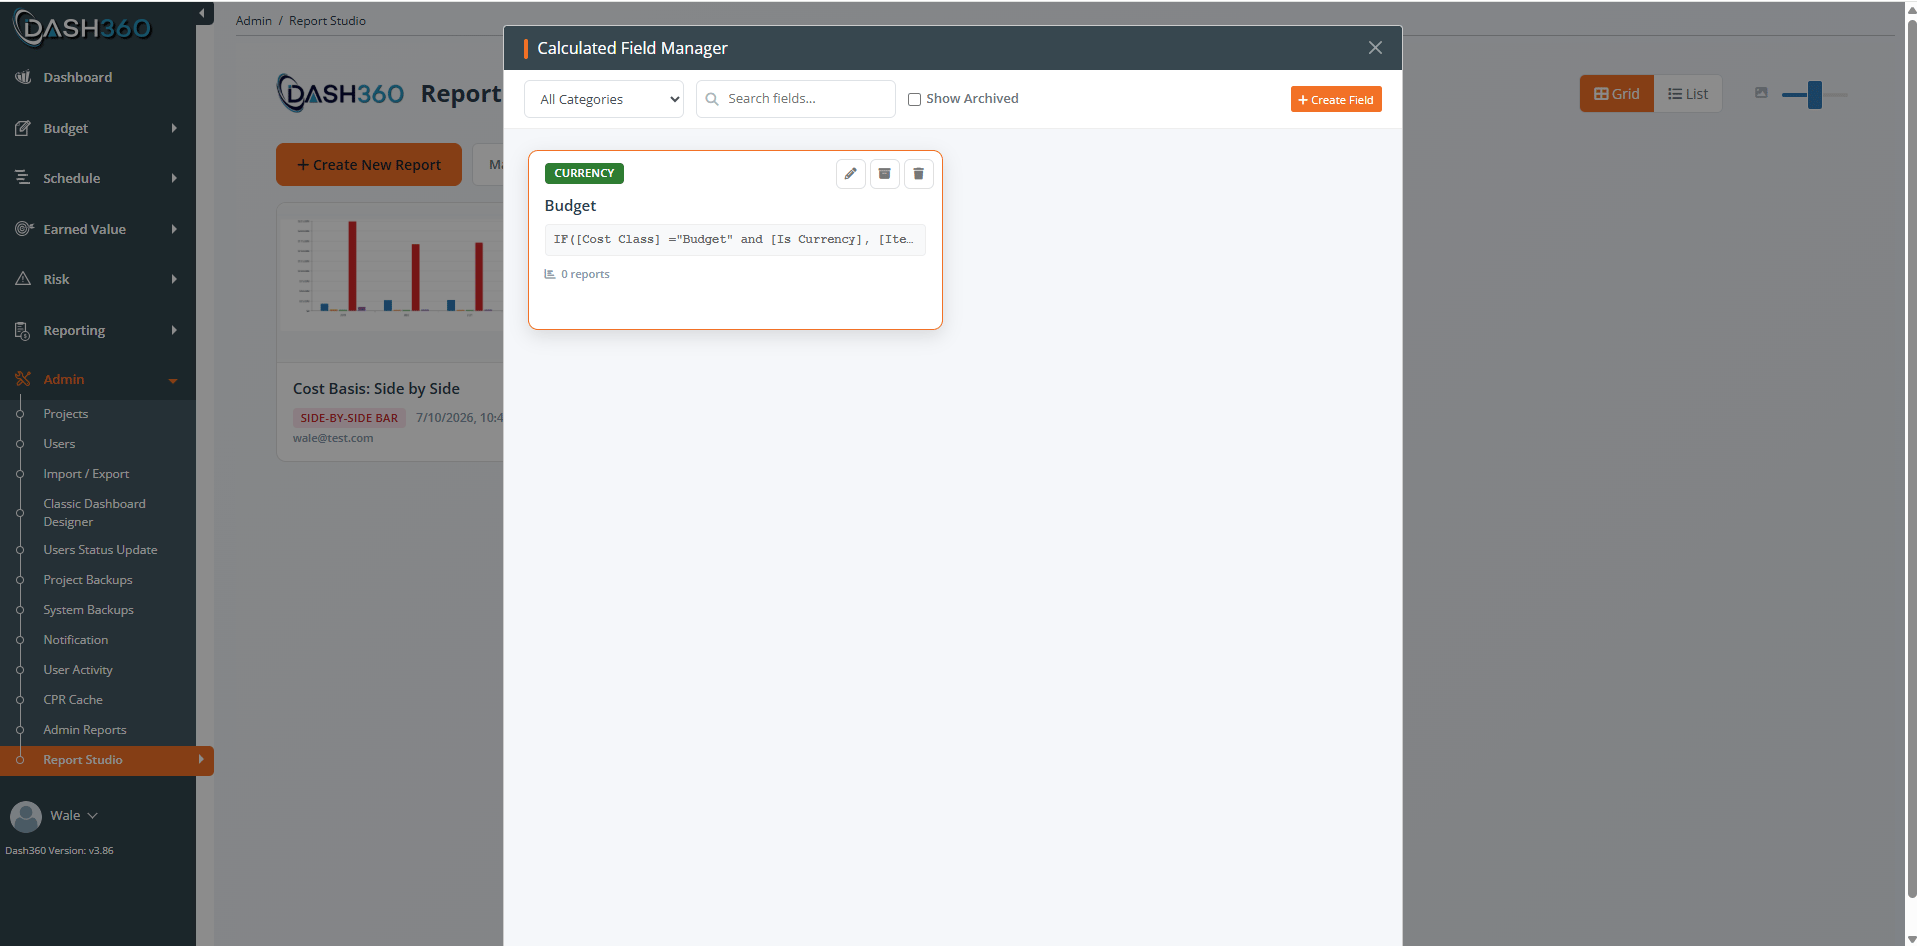
Formulas you expect to reuse can be saved to a shared **calculated-field library** so you and other Admins can drop them into any report.
* Open the library from **Manage Library** on the landing page, or save a field to the library while building it.
* Library fields behave like inline calculated fields once added to a report.
### Formula syntax
**Field references**: Wrap field names in square brackets, for example `[Item Cost]`. Insert them from the field list to avoid typos.
**Operators**: `+` `-` `*` (or `×`) `/` (or `÷`) `=` `<>` `<` `>` along with `AND`, `OR`, and `NOT`.
**Functions** available include:
| Group | Functions |
| ----------------- | ---------------------------------------------------------------------------------- |
| **Conditional** | `IF` (also `IIF`), `SWITCH` |
| **Aggregate** | `SUM`, `AVG`, `COUNT`, `MIN`, `MAX` |
| **Math** | `ROUND`, `ABS`, `CEILING`, `FLOOR`, `SQRT`, `POWER` |
| **Null handling** | `ISNULL`, `COALESCE` |
| **Date** | `YEAR`, `MONTH`, `DAY`, `DATEDIFF`, `DATEADD`, `TODAY`, `NOW` |
| **Text** | `CONCAT`, `UPPER`, `LOWER`, `TRIM`, `LEN`, `LEFT`, `RIGHT`, `SUBSTRING`, `REPLACE` |
In `IF` formulas that split values, use `NULL` for the "else" result, not `0`. Returning `0` adds ghost zeros that distort averages, minimums, and maximums.
### Recipe: Budget vs Actual
A common need is to show Budget and Actual as separate columns and then compare them. Because Cost Class arrives as separate rows (one Budget row, one Actual row), you split it with row-level formulas and then combine with aggregate formulas.
**Step 1: row-level fields** (one value per row)
```
BudgetCost = IF([CostClass]='Budget', [ItemCost], NULL)
ActualCost = IF([CostClass]='Actual', [ItemCost], NULL)
```
**Step 2: aggregate fields** (across each group and the totals)
```
CostVariance = SUM([BudgetCost]) - SUM([ActualCost])
CPI = SUM([EarnedCost]) / SUM([ActualCost])
```
The Designer resolves dependencies automatically, so `BudgetCost` is calculated before `CostVariance` uses it.
### Dependencies and limits
* Calculated fields can reference other calculated fields, creating a chain. The Designer evaluates them in the correct order.
* **Circular references are not allowed** (Field A references Field B, and Field B references Field A). The Designer blocks them.
* You cannot delete a calculated field that another field depends on; remove or update the dependent field first.
## The shared library
Formulas you expect to reuse can be saved to a shared **calculated-field library** so you and other Admins can drop them into any report.
* Open the library from **Manage Library** on the landing page, or save a field to the library while building it.
* Library fields behave like inline calculated fields once added to a report.
 ## Where to go next
Ready-to-use formulas and how to fix wrong results.
Overview, the landing page, and building your first report.
Save, control visibility, copy, export/import, and publish.
Snapshots, filters, permissions, and caching.
## Where to go next
Ready-to-use formulas and how to fix wrong results.
Overview, the landing page, and building your first report.
Save, control visibility, copy, export/import, and publish.
Snapshots, filters, permissions, and caching.