> ## Documentation Index
> Fetch the complete documentation index at: https://docs.dash360.com/llms.txt
> Use this file to discover all available pages before exploring further.
# Building a Pivot Grid
> Step-by-step guide to building a Pivot Grid report, the four field zones, every layout and totals option, performance tips, and pitfalls.
# Building a Pivot Grid
A Pivot Grid is a cross-tabular report. You drag fields into zones to summarize cost across two dimensions at once, for example WBS down the side and fiscal year across the top, with cost in the cells. Use it for analysis and roll-ups.
This page is part of the [Report Studio](/user-guide/reporting/report-designer) guide.
## Build it
On the landing page, click **Create New Report** and choose **Pivot Grid**.
Select one or more project snapshots.
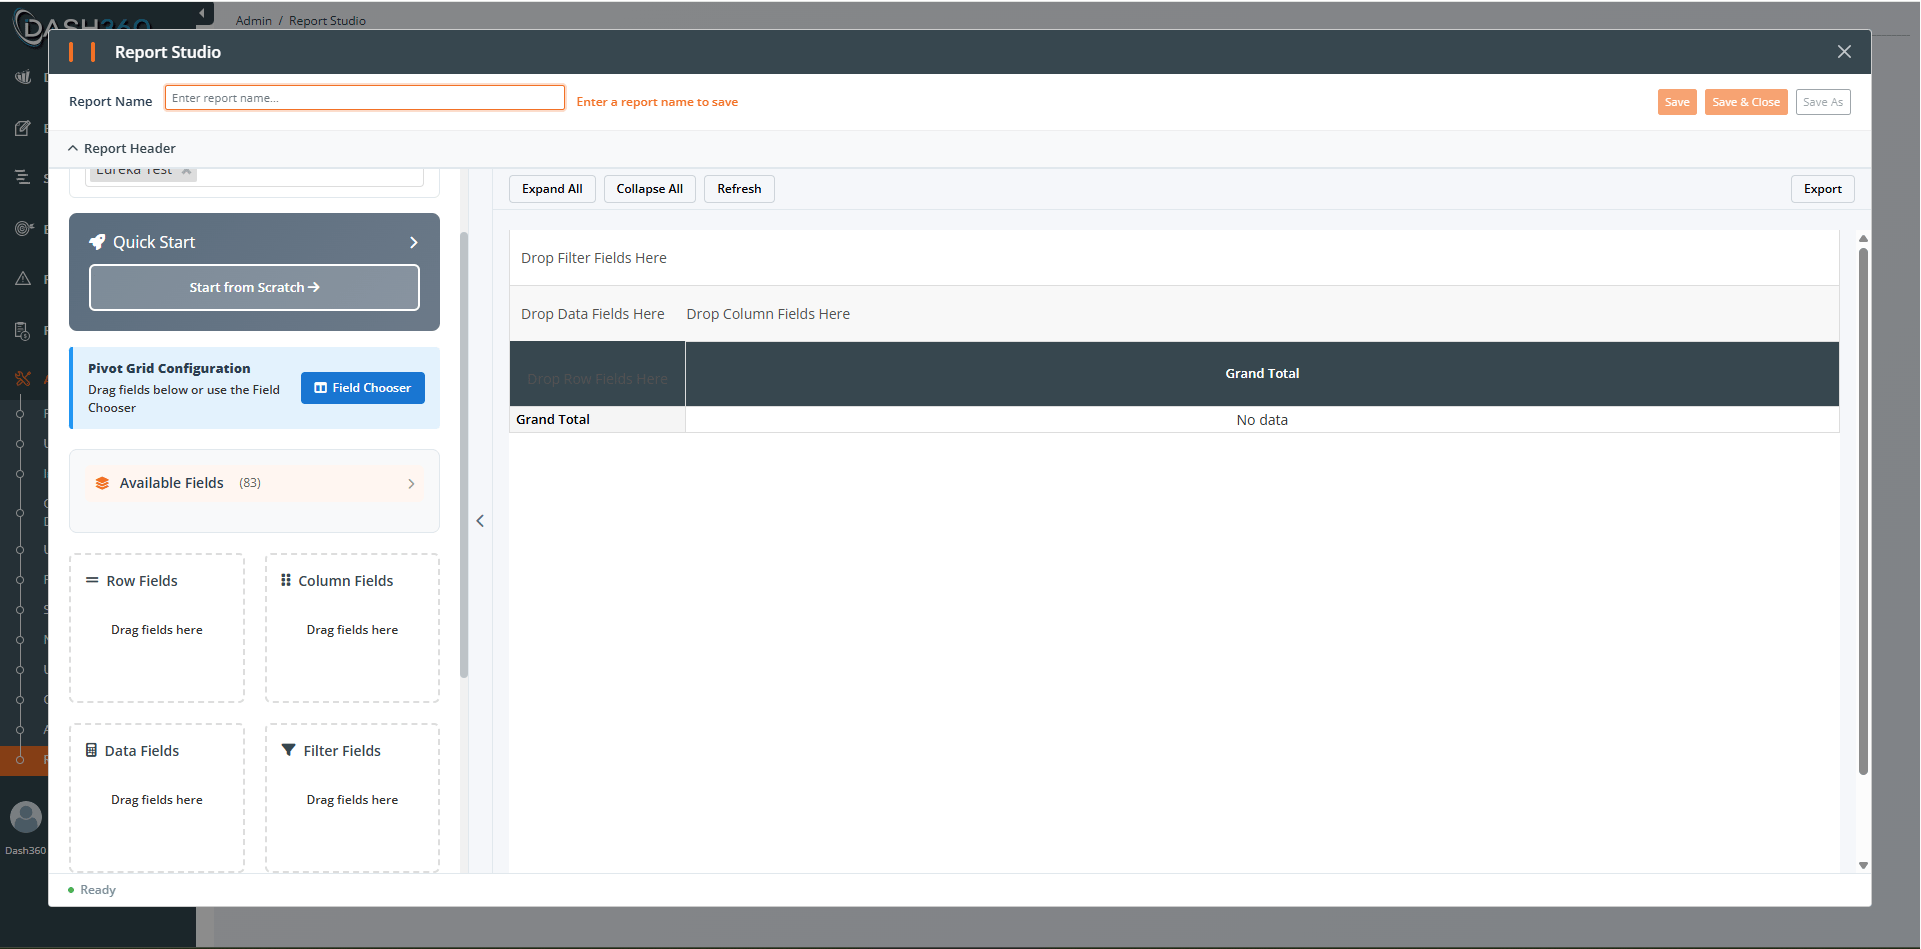
The **Quick Start** section offers preset templates for common layouts. Pick one to get a head start, or click **Start from Scratch**.
Use the **Pivot Field Manager** to drag fields into four zones (see below). Drag within a zone to reorder, drag to another zone to move, or click the X to remove.
Click the summary-type badge on a Data field to choose how it is summarized: **sum**, **avg**, **count**, **min**, **max**, **diffRow** (difference across rows), or **diffCol** (difference across columns).
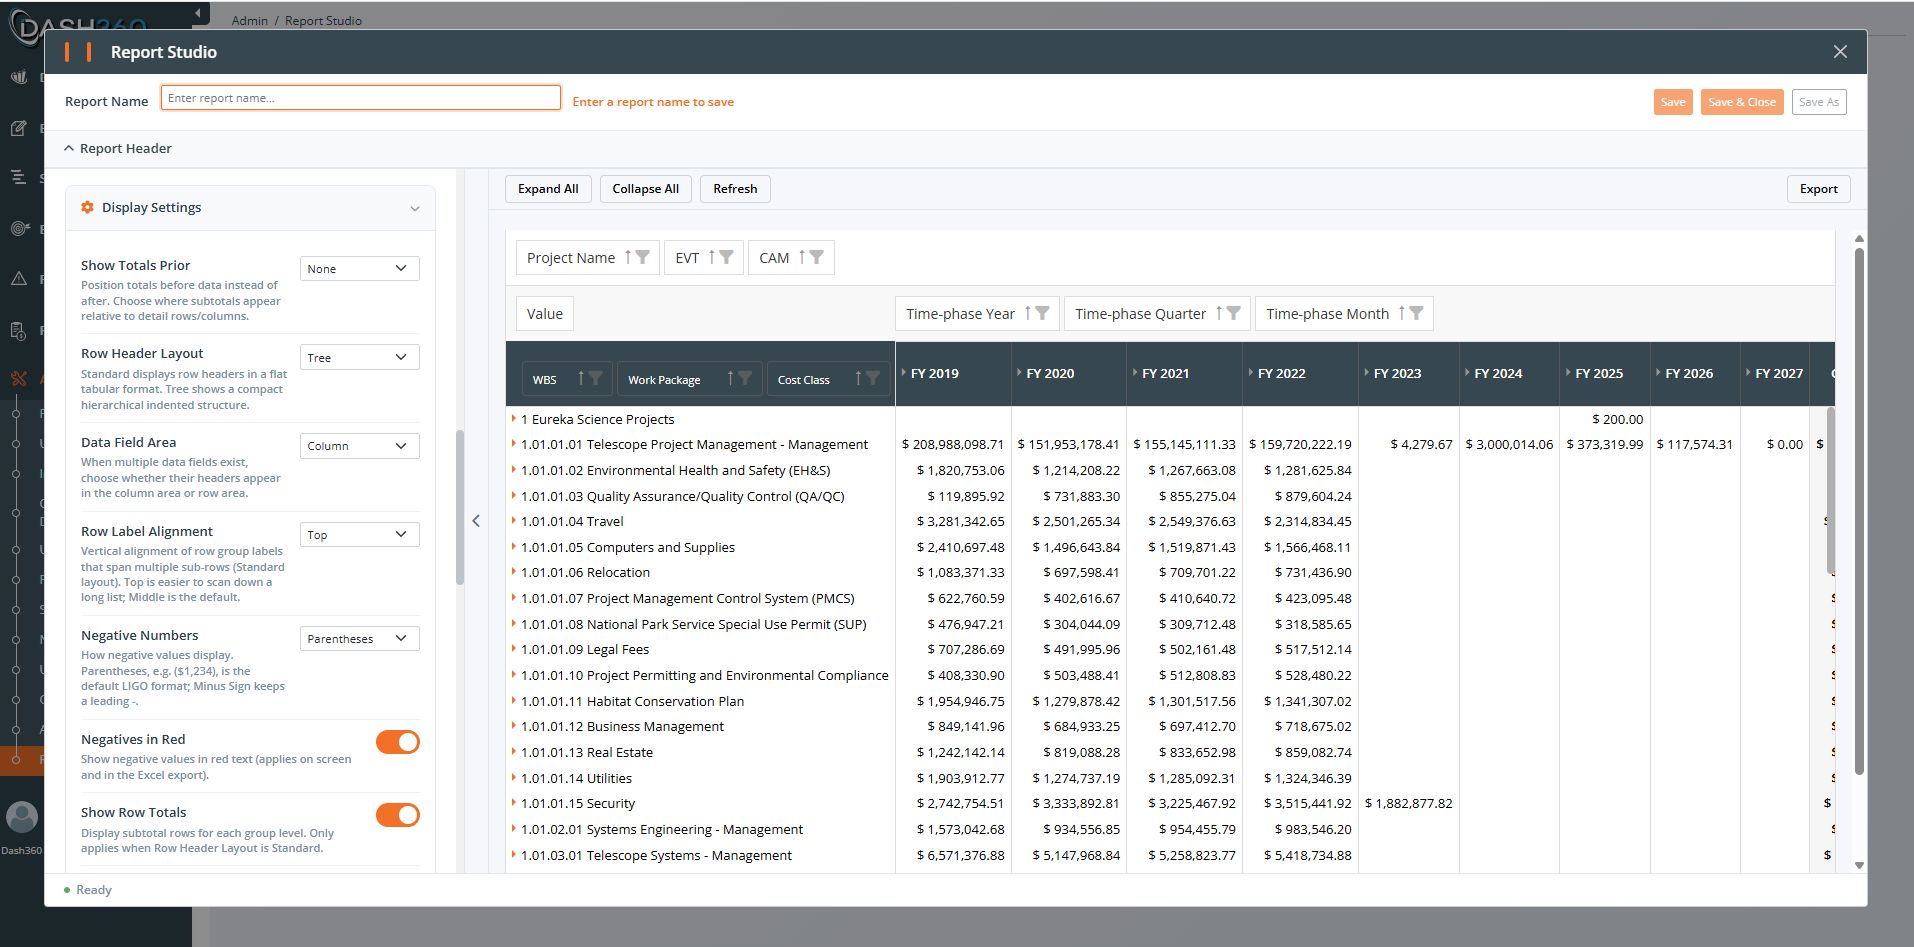
Open **Display Settings** to set layout, totals, captions, and interaction options (see below).
Add a title, subtitle, and description, then click **Save**.
## The four zones
| Zone | What it does |
| ----------------- | ----------------------------------------------------------------------------- |
| **Row Fields** | Groups data into rows down the left side |
| **Column Fields** | Groups data into columns across the top |
| **Data Fields** | The values calculated and shown in the cells (sum, average, count, and so on) |
| **Filter Fields** | Dropdown filters above the grid that narrow the data |
Rename any field for display by clicking its name and editing the caption. This does not change the underlying data.
 ## Display settings
### Layout
| Setting | Choices | What it does |
| --------------------- | ------------------------- | -------------------------------------------------------------- |
| **Show Totals Prior** | None, Rows, Columns, Both | Put totals before the data instead of after |
| **Row Header Layout** | Tree, Standard | Tree is compact and hierarchical; Standard is flat and tabular |
| **Data Field Area** | Column, Row | When you have several Data fields, where their headers appear |
### Totals
| Setting | What it does | Default |
| ---------------------------- | ------------------------------------------------------------------------------- | ------- |
| **Show Row Totals** | Subtotal rows for each group level (applies when Row Header Layout is Standard) | On |
| **Show Column Totals** | Subtotal columns for each level in the column headers | On |
| **Show Row Grand Totals** | The grand-total row at the bottom | On |
| **Show Column Grand Totals** | The grand-total column on the right | On |
### Total captions
* **Subtotal Label**: customize the subtotal label; use `{0}` for the group name (placeholder is `{0} Total`).
* **Grand Total Row Label**: customize the grand-total row label (placeholder is `Grand Total`).
* **Grand Total Column Label**: customize the grand-total column header.
### Display
* **Word Wrap**: wrap long header text instead of cutting it off (default off).
* **Alternating Rows**: zebra striping for readability (default off).
### Interaction
| Setting | What it does | Default |
| ---------------------- | ------------------------------------------- | ------- |
| **Allow Sorting** | Users can click headers to sort | On |
| **Allow Filtering** | Users can filter through header dropdowns | On |
| **Show Filter Fields** | Show the filter field area above the grid | On |
| **Show Column Fields** | Show the column field area | On |
| **Show Row Fields** | Show the row field area | On |
| **Show Data Fields** | Show the data field area in the field panel | On |
### Fiscal Year prefix
As with the Data Grid, the fiscal-year prefix is detected automatically when all projects match, and offered as a **Show Fiscal Year Prefix** toggle when you mix fiscal and calendar projects.
## Display settings
### Layout
| Setting | Choices | What it does |
| --------------------- | ------------------------- | -------------------------------------------------------------- |
| **Show Totals Prior** | None, Rows, Columns, Both | Put totals before the data instead of after |
| **Row Header Layout** | Tree, Standard | Tree is compact and hierarchical; Standard is flat and tabular |
| **Data Field Area** | Column, Row | When you have several Data fields, where their headers appear |
### Totals
| Setting | What it does | Default |
| ---------------------------- | ------------------------------------------------------------------------------- | ------- |
| **Show Row Totals** | Subtotal rows for each group level (applies when Row Header Layout is Standard) | On |
| **Show Column Totals** | Subtotal columns for each level in the column headers | On |
| **Show Row Grand Totals** | The grand-total row at the bottom | On |
| **Show Column Grand Totals** | The grand-total column on the right | On |
### Total captions
* **Subtotal Label**: customize the subtotal label; use `{0}` for the group name (placeholder is `{0} Total`).
* **Grand Total Row Label**: customize the grand-total row label (placeholder is `Grand Total`).
* **Grand Total Column Label**: customize the grand-total column header.
### Display
* **Word Wrap**: wrap long header text instead of cutting it off (default off).
* **Alternating Rows**: zebra striping for readability (default off).
### Interaction
| Setting | What it does | Default |
| ---------------------- | ------------------------------------------- | ------- |
| **Allow Sorting** | Users can click headers to sort | On |
| **Allow Filtering** | Users can filter through header dropdowns | On |
| **Show Filter Fields** | Show the filter field area above the grid | On |
| **Show Column Fields** | Show the column field area | On |
| **Show Row Fields** | Show the row field area | On |
| **Show Data Fields** | Show the data field area in the field panel | On |
### Fiscal Year prefix
As with the Data Grid, the fiscal-year prefix is detected automatically when all projects match, and offered as a **Show Fiscal Year Prefix** toggle when you mix fiscal and calendar projects.
 ## Performance: apply filters early
Like the Data Grid, the Pivot Grid runs on the server. Reduce the data it has to crunch:
**Use Filter Fields and pick fewer projects.** A pivot over one WBS branch and one cost class is far quicker than the entire project across every dimension. Add filters before expanding everything.
* **Fewer Row and Column fields** means a smaller cross-tab to compute.
* **Expand sections on demand** rather than expanding all at once on a large pivot.
* **Results are cached for up to 30 minutes** for the same projects, fields, and filters.
## Pitfalls to avoid
* **Putting a very high-cardinality field on Columns** (for example, monthly periods across many years) creates a huge, slow grid. Filter the time range, or move it to Rows.
* **Choosing the wrong summary type.** Cost fields almost always want **sum**. **count** counts rows, not money. **avg/min/max** can mislead if your data has Budget, Actual, and Earned rows mixed together; consider splitting those with calculated fields first (see the [Budget vs Actual recipe](/user-guide/reporting/report-designer-fields#recipe-budget-vs-actual)).
* **Expecting row totals with Tree layout.** Some subtotal options apply only to the Standard row header layout.
* **Assuming a saved view remembers filters.** It remembers layout, not filters.
## Where to go next
Pie, bar, stacked, line, area, and trellis charts.
Ready-to-use formulas and how to fix wrong results.
## Performance: apply filters early
Like the Data Grid, the Pivot Grid runs on the server. Reduce the data it has to crunch:
**Use Filter Fields and pick fewer projects.** A pivot over one WBS branch and one cost class is far quicker than the entire project across every dimension. Add filters before expanding everything.
* **Fewer Row and Column fields** means a smaller cross-tab to compute.
* **Expand sections on demand** rather than expanding all at once on a large pivot.
* **Results are cached for up to 30 minutes** for the same projects, fields, and filters.
## Pitfalls to avoid
* **Putting a very high-cardinality field on Columns** (for example, monthly periods across many years) creates a huge, slow grid. Filter the time range, or move it to Rows.
* **Choosing the wrong summary type.** Cost fields almost always want **sum**. **count** counts rows, not money. **avg/min/max** can mislead if your data has Budget, Actual, and Earned rows mixed together; consider splitting those with calculated fields first (see the [Budget vs Actual recipe](/user-guide/reporting/report-designer-fields#recipe-budget-vs-actual)).
* **Expecting row totals with Tree layout.** Some subtotal options apply only to the Standard row header layout.
* **Assuming a saved view remembers filters.** It remembers layout, not filters.
## Where to go next
Pie, bar, stacked, line, area, and trellis charts.
Ready-to-use formulas and how to fix wrong results.