> ## Documentation Index
> Fetch the complete documentation index at: https://docs.dash360.com/llms.txt
> Use this file to discover all available pages before exploring further.
# Report Gallery
> Access, run, filter, save personal views, and export Dash360 reports from one central viewer.
# Report Gallery
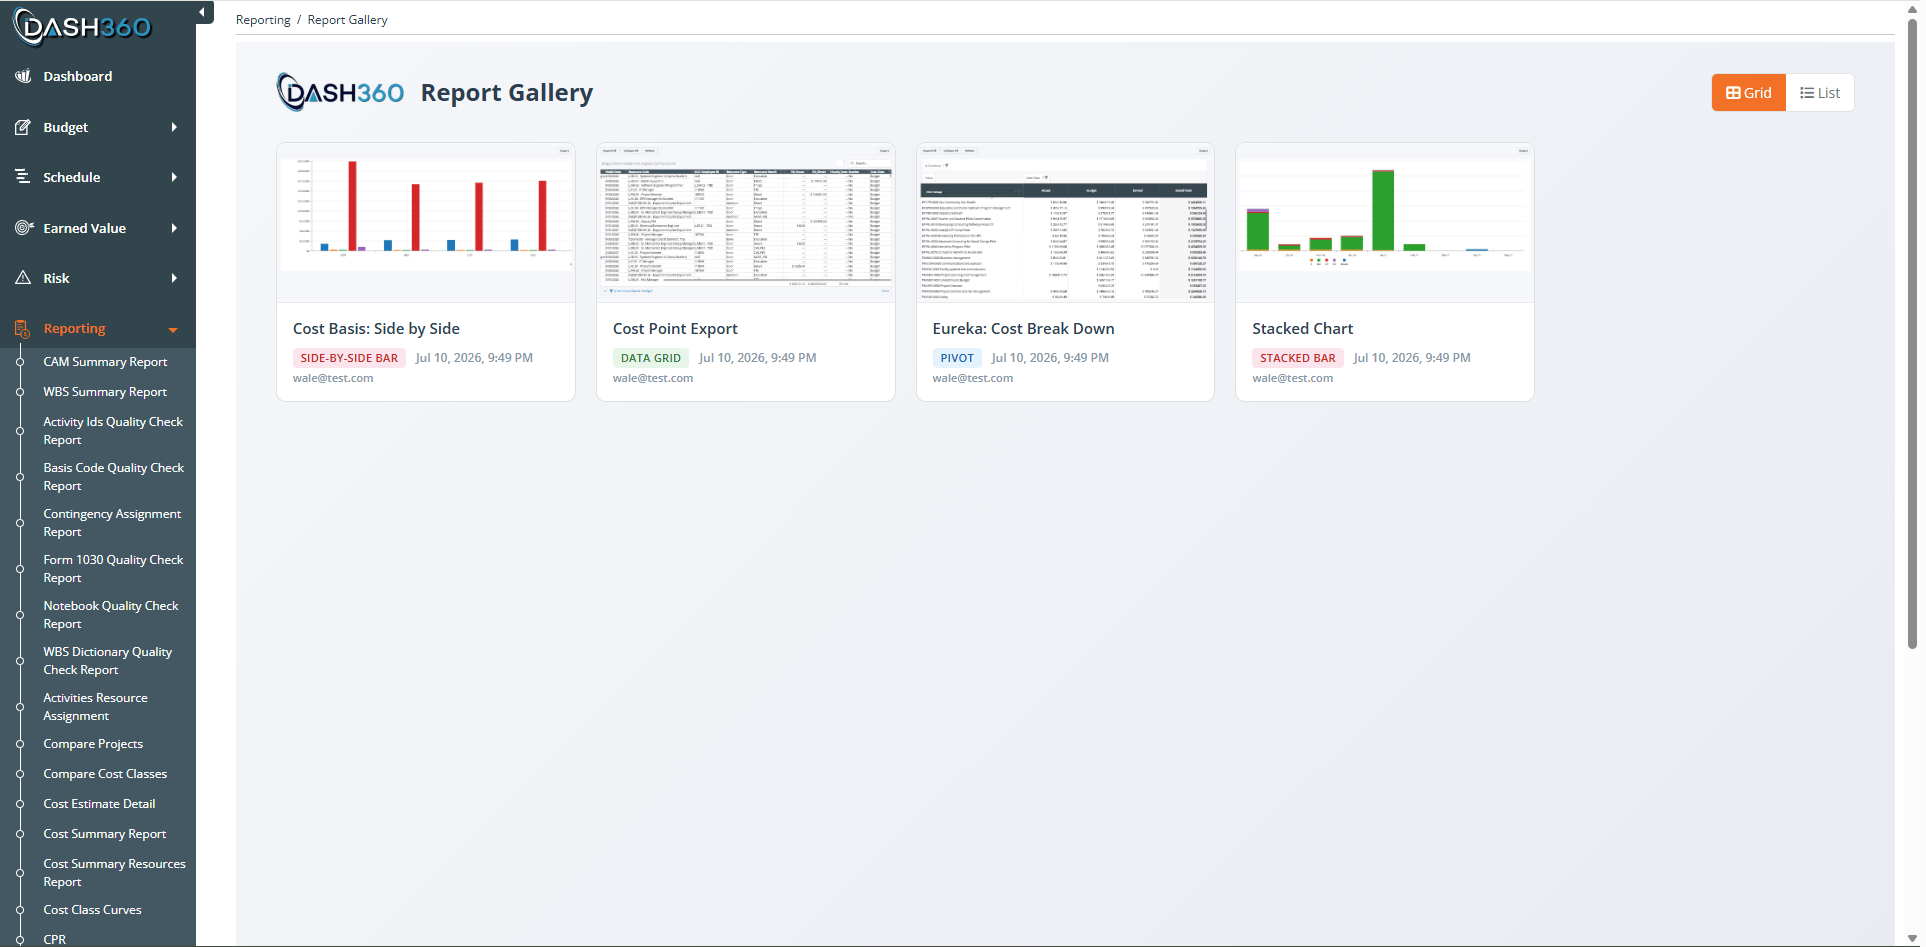
The Report Gallery is the central place to find and run Dash360 reports, both the standard built-in reports and the custom reports built in [Report Studio](/user-guide/reporting/report-designer). It is read-only: you cannot change a report's design, but you can filter it, rearrange it for your own use, save your own views, and export the results.
You do not need Admin rights to use the Viewer. Anyone with access to a report can open and run it. What you see is limited by your Work Package permissions, so two users can open the same report and see different rows.
Full documentation for the standard built-in report list is coming soon. The sections below apply to the custom reports built in Report Studio.
## Opening a report
There are two common ways to open a report:
* An Admin sends you a link, for example `/Reporting/CetpReportViewer?reportId=`.
* From the Report Studio landing page (Admins), click the **Open in Viewer** icon on a report card.
The report loads with the projects and layout chosen by whoever built it.
 ## Filtering a report
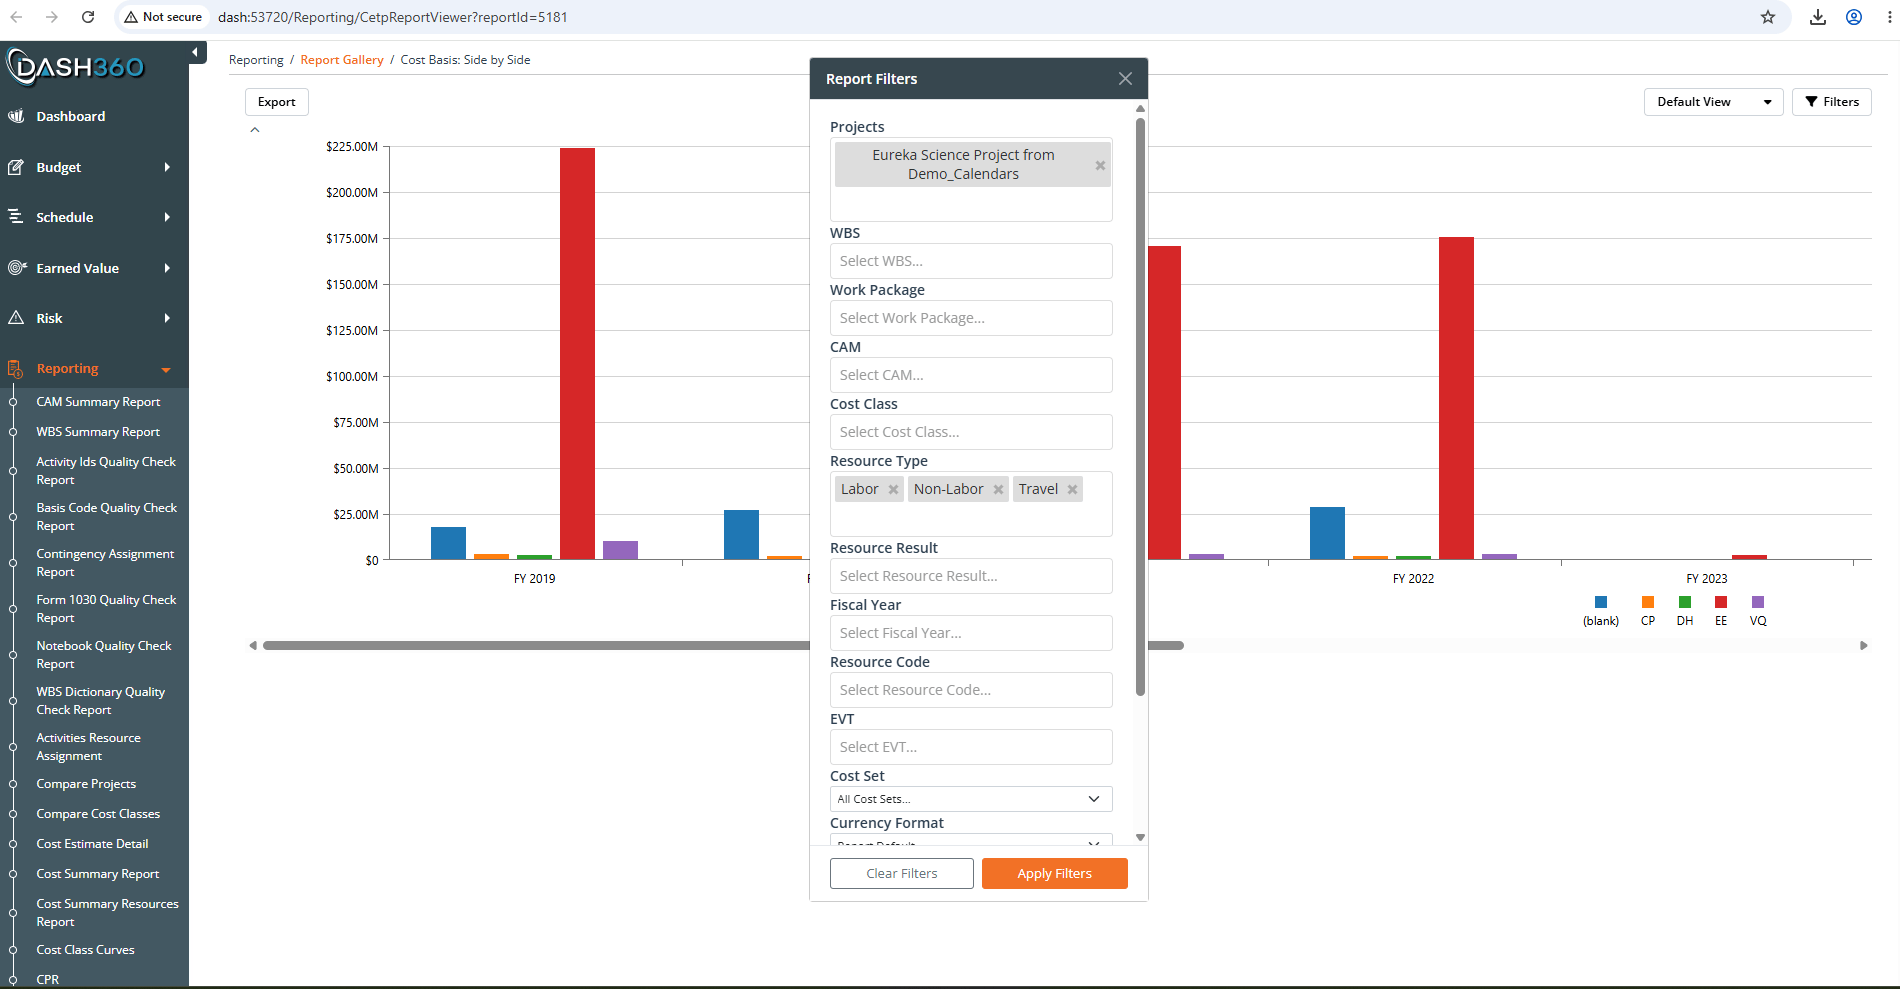
Use the filters at the top of the report to narrow the data. Typical filters include WBS, Work Package, CAM, Cost Class, and Resource Type. Filters apply immediately and affect the whole report, including totals.
For grid reports you can also filter and search directly in the grid:
* **Header filter**: Click the filter icon on a column header to pick values.
* **Filter row**: If enabled, type directly under each column heading.
* **Search**: Use the search box to find text across the report.
## Filtering a report
Use the filters at the top of the report to narrow the data. Typical filters include WBS, Work Package, CAM, Cost Class, and Resource Type. Filters apply immediately and affect the whole report, including totals.
For grid reports you can also filter and search directly in the grid:
* **Header filter**: Click the filter icon on a column header to pick values.
* **Filter row**: If enabled, type directly under each column heading.
* **Search**: Use the search box to find text across the report.
 ## Working with grid reports
Data Grid and Pivot Grid reports are interactive:
* **Sort**: Click a column header. Hold and click another to sort by several columns.
* **Group**: Drag a column into the group panel to group rows by it (Data Grid).
* **Expand and collapse**: Open and close group rows and pivot sections.
* **Rearrange**: Show or hide columns with the column chooser; in a Pivot Grid, drag fields between the Rows, Columns, Data, and Filter zones.
* **Totals**: Group subtotals and a grand total appear when the report is set up to show them.
Calculated columns (marked with a calculator icon) behave like any other column: you can sort, filter, group, and total them. Hover the header to see the formula behind a calculated column.
## Saving your own views
A **view** saves how you have arranged a report (columns, order, grouping, sorting, widths, and expanded groups) so it comes back the same way next time. Views are a convenience layer on top of the report; they do not change the report's design for anyone else.
Set the columns, order, grouping, and sorting the way you want.
Open the views menu and choose **Create New User View**. Give it a name and save. The view is yours and loads whenever you choose it.
Use the gear icon next to a view and choose **Make Default View** so it loads automatically every time you open the report.
## Working with grid reports
Data Grid and Pivot Grid reports are interactive:
* **Sort**: Click a column header. Hold and click another to sort by several columns.
* **Group**: Drag a column into the group panel to group rows by it (Data Grid).
* **Expand and collapse**: Open and close group rows and pivot sections.
* **Rearrange**: Show or hide columns with the column chooser; in a Pivot Grid, drag fields between the Rows, Columns, Data, and Filter zones.
* **Totals**: Group subtotals and a grand total appear when the report is set up to show them.
Calculated columns (marked with a calculator icon) behave like any other column: you can sort, filter, group, and total them. Hover the header to see the formula behind a calculated column.
## Saving your own views
A **view** saves how you have arranged a report (columns, order, grouping, sorting, widths, and expanded groups) so it comes back the same way next time. Views are a convenience layer on top of the report; they do not change the report's design for anyone else.
Set the columns, order, grouping, and sorting the way you want.
Open the views menu and choose **Create New User View**. Give it a name and save. The view is yours and loads whenever you choose it.
Use the gear icon next to a view and choose **Make Default View** so it loads automatically every time you open the report.
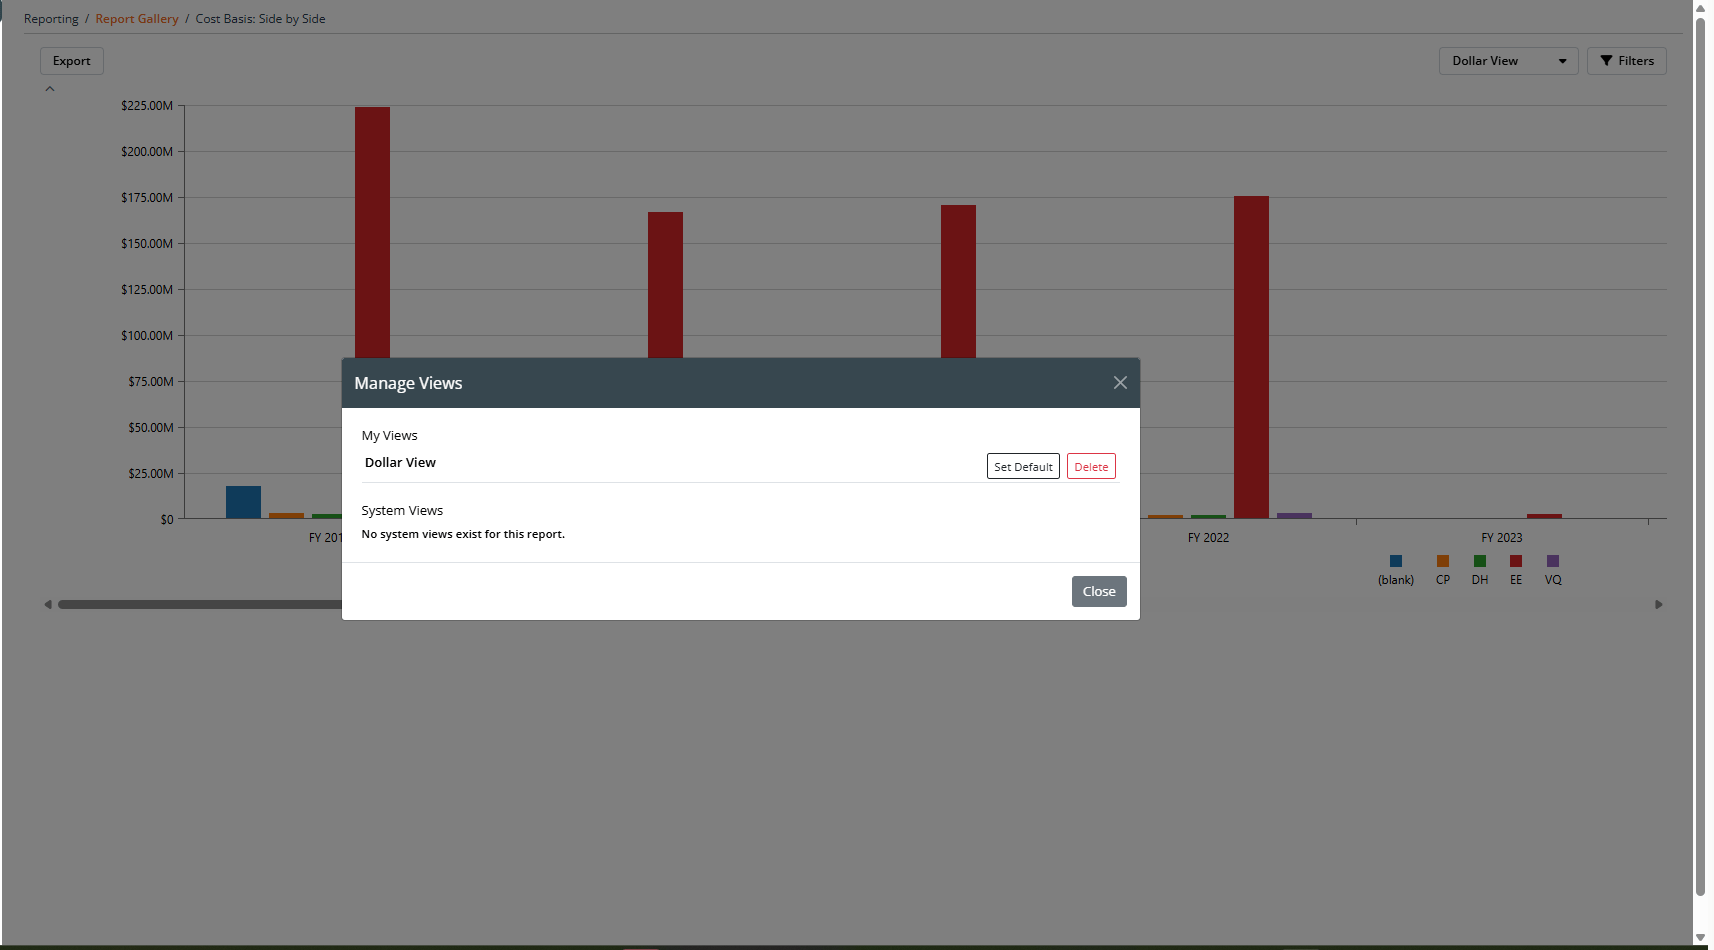 Filter selections are not saved as part of a view. When you reload a view or log back in, filters return to their default. Column layout, grouping, and sorting are saved; filters are not.
### Sharing views (Admins)
Admins can turn a personal view into a **system view** that everyone sees:
* Use the gear icon on a view and choose **Copy to System View**.
* Choose **Make Default System View** to make it the default for all users of that report.
For the full views workflow that applies across Dash360 reports, see the [User Views](/user-guide/concepts/section-views) guidance.
## Exporting
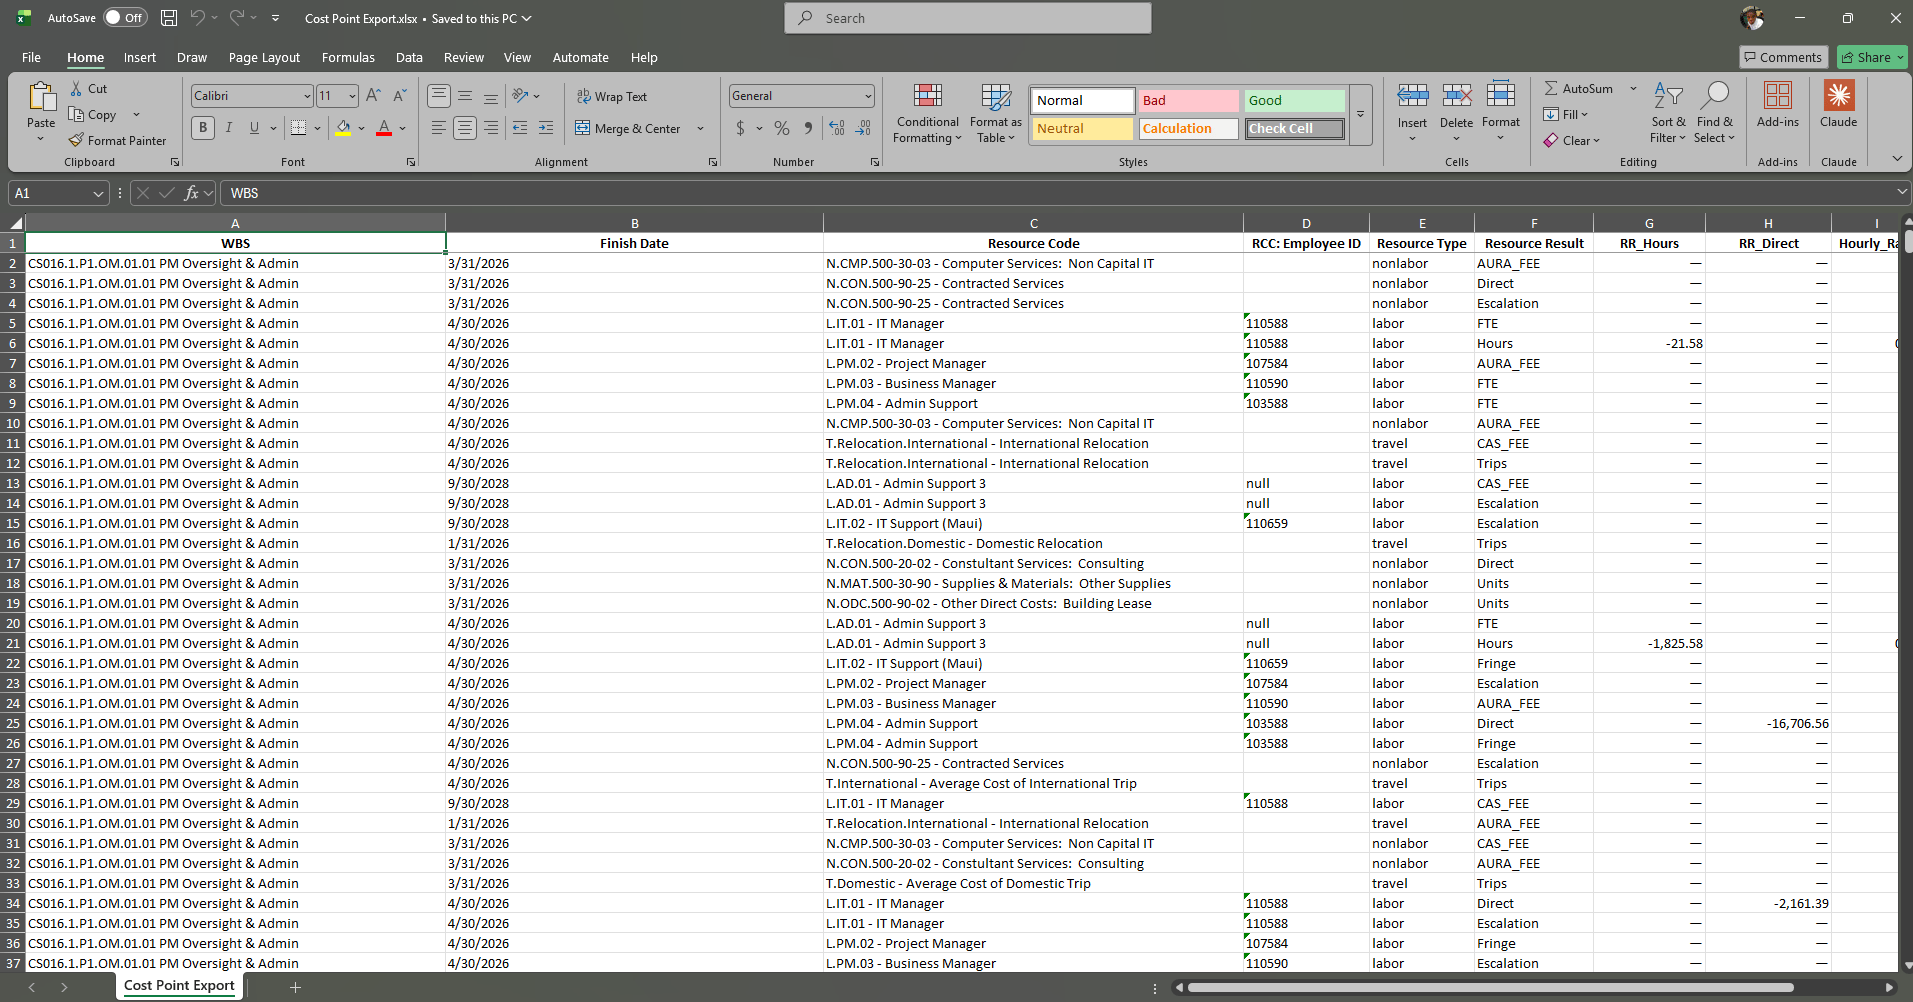
Grid reports export to **Excel** so you can share or do further analysis offline. Chart reports offer their own export, and many charts can include a data table beneath the chart for export. Use the export control on the report to download.
An export reflects your current filters and layout, so set those the way you want before exporting.
Filter selections are not saved as part of a view. When you reload a view or log back in, filters return to their default. Column layout, grouping, and sorting are saved; filters are not.
### Sharing views (Admins)
Admins can turn a personal view into a **system view** that everyone sees:
* Use the gear icon on a view and choose **Copy to System View**.
* Choose **Make Default System View** to make it the default for all users of that report.
For the full views workflow that applies across Dash360 reports, see the [User Views](/user-guide/concepts/section-views) guidance.
## Exporting
Grid reports export to **Excel** so you can share or do further analysis offline. Chart reports offer their own export, and many charts can include a data table beneath the chart for export. Use the export control on the report to download.
An export reflects your current filters and layout, so set those the way you want before exporting.
 ## Editing a report in Report Studio
If you have Report Studio access, the report toolbar shows an **Edit in Report Studio** button. Clicking it opens Report Studio in a new browser tab with that report's editor already open, so you can jump straight to a fix (for example, correcting a title) without navigating to Admin and hunting for the report. The tab you were viewing stays open.
The button appears only when both of these are true:
* You have Report Studio access (a Dash360 account, or an administrator on a server where Report Studio is enabled).
* The report was built in Report Studio. Custom reports (such as Budget vs Actual and the NRAO Fiscal Year Report) have no Report Studio editor, so the button is hidden for them.
{/* viewer-edit-in-report-studio.png: The Report Viewer toolbar with the "Edit in Report Studio" button visible next to Filters. */}
## Why your numbers might differ from a colleague's
If two people open the same report and see different totals, the most common reasons are:
1. **Work Package permissions**: Each user sees only the rows they are allowed to see.
2. **Different filters**: One of you has a filter applied that the other does not.
3. **Different snapshots**: The report's projects or snapshots were changed since one of you last opened it.
For the full checklist of why a report's data can look wrong (and how to fix it), see [Understanding Your Data](/user-guide/reporting/report-designer-troubleshooting).
## Where to go next
Diagnose permissions, stale data, and other reasons a report's numbers look off.
Build reports (Admins).
Control visibility and share reports (Admins).
## Editing a report in Report Studio
If you have Report Studio access, the report toolbar shows an **Edit in Report Studio** button. Clicking it opens Report Studio in a new browser tab with that report's editor already open, so you can jump straight to a fix (for example, correcting a title) without navigating to Admin and hunting for the report. The tab you were viewing stays open.
The button appears only when both of these are true:
* You have Report Studio access (a Dash360 account, or an administrator on a server where Report Studio is enabled).
* The report was built in Report Studio. Custom reports (such as Budget vs Actual and the NRAO Fiscal Year Report) have no Report Studio editor, so the button is hidden for them.
{/* viewer-edit-in-report-studio.png: The Report Viewer toolbar with the "Edit in Report Studio" button visible next to Filters. */}
## Why your numbers might differ from a colleague's
If two people open the same report and see different totals, the most common reasons are:
1. **Work Package permissions**: Each user sees only the rows they are allowed to see.
2. **Different filters**: One of you has a filter applied that the other does not.
3. **Different snapshots**: The report's projects or snapshots were changed since one of you last opened it.
For the full checklist of why a report's data can look wrong (and how to fix it), see [Understanding Your Data](/user-guide/reporting/report-designer-troubleshooting).
## Where to go next
Diagnose permissions, stale data, and other reasons a report's numbers look off.
Build reports (Admins).
Control visibility and share reports (Admins).