> ## Documentation Index
> Fetch the complete documentation index at: https://docs.dash360.com/llms.txt
> Use this file to discover all available pages before exploring further.
# Correlation and Activity Mapping
> What correlation means in Dash360 Risk, how Risk-to-Risk correlation, Activity-to-Activity correlation, and Activity-to-Risk mapping each work, what each one affects in the Monte Carlo, and how they relate.
## Overview
Dash360 Risk has three related but distinct features that people often blur together. Two of them are **correlation** (they link uncertainty so items move together), and one is **mapping** (it routes a risk's schedule impact to activities). Keeping them separate is the key to reading your Monte Carlo results correctly.
| Feature | Family | One-line summary |
| ------------------------------------ | ----------- | --------------------------------------------------------------------------------------------------------------------------------------------------------------------- |
| **Activity-to-Risk Mapping** | Routing | Tells the schedule Monte Carlo which activities a risk's schedule impact should land on. |
| **Risk-to-Risk Correlation** | Correlation | Tells the simulation that two or more risks move together: they tend to occur in the same iterations, and their impacts tend to be large (or small) at the same time. |
| **Activity-to-Activity Correlation** | Correlation | Tells the simulation that two or more activities move together (run long or short together on both duration and cost). |
Correlation links **like to like**: a risk to another risk, or an activity to another activity. There is **no risk-to-activity correlation** in Dash360. The only thing that links a risk to an activity is Activity Mapping, and that is routing, not correlation.
***
## What "correlation" means in Dash360
By default, every activity and every risk is sampled **independently** in each Monte Carlo iteration. Independent draws tend to cancel out: in a given iteration one item lands high while another lands low, so the totals average toward the middle. That understates the real spread of the total, because in the real world related items often move in the same direction at the same time.
**Correlation** is how you tell the simulation that certain items move together. When you correlate items, they share their random draw in each iteration, so they tend to land high together or low together.
Each correlation group has a single **coefficient** from -100% to +100%:
* **+100%**: the members take the driver's draw exactly (they fully move together).
* **A positive value below 100%**: the members move partly with the driver and partly on their own.
* **0%**: independent (no effect).
* **A negative value**: the members tend to move opposite the driver.
Correlation is applied at the random-draw level using a single-factor Gaussian copula, so the shape of each item's own distribution is preserved. Positive correlation **widens** the total cost and finish-date distributions (higher P80 and P90) because related items no longer cancel each other out. That is the more realistic result. The graphs keep the same shape and chart types; only the numbers shift.
The point of correlation is honesty about spread, not a bigger mean. Correlation barely moves the average result; it widens the tails, which is exactly where contingency decisions (P80, P90) are made. For the underlying math, see [How the Dash360 Monte Carlo Works](/user-guide/concepts/monte-carlo-methodology#correlation-pro).
***
## The three mechanisms
### 1. Activity-to-Risk Mapping (routing)
 **Where:** the **Activity Mapping** area of the Add/Edit Risk form (Risk Register).
**What it is:** it maps a risk to the specific **schedule activities** its schedule impact should hit. This is what lets the schedule Monte Carlo apply the risk's delay to the right activities on the critical path.
**Why you do it:** so a risk's schedule impact lands where it actually occurs, and so the **Activity Drivers** analytics chart can show which activities carry the most risk exposure. A risk with no activity mapping still contributes, but its schedule impact is applied to the **project finish** directly instead of to specific activities.
**What it affects:** where a risk's schedule impact is applied. It uses a **Mapping Mode**:
* **Relative** (default): distribute the impact across the mapped activities by each activity's **Weight (%)**.
* **Absolute**: apply the full impact to each mapped activity.
**What it does NOT do:** it is not correlation. Mapping never changes whether or how strongly two risks (or two activities) move together.
**Availability:** This feature is available in all versions.
### 2. Risk-to-Risk Correlation (Pro)
**Where:** the **Activity Mapping** area of the Add/Edit Risk form (Risk Register).
**What it is:** it maps a risk to the specific **schedule activities** its schedule impact should hit. This is what lets the schedule Monte Carlo apply the risk's delay to the right activities on the critical path.
**Why you do it:** so a risk's schedule impact lands where it actually occurs, and so the **Activity Drivers** analytics chart can show which activities carry the most risk exposure. A risk with no activity mapping still contributes, but its schedule impact is applied to the **project finish** directly instead of to specific activities.
**What it affects:** where a risk's schedule impact is applied. It uses a **Mapping Mode**:
* **Relative** (default): distribute the impact across the mapped activities by each activity's **Weight (%)**.
* **Absolute**: apply the full impact to each mapped activity.
**What it does NOT do:** it is not correlation. Mapping never changes whether or how strongly two risks (or two activities) move together.
**Availability:** This feature is available in all versions.
### 2. Risk-to-Risk Correlation (Pro)
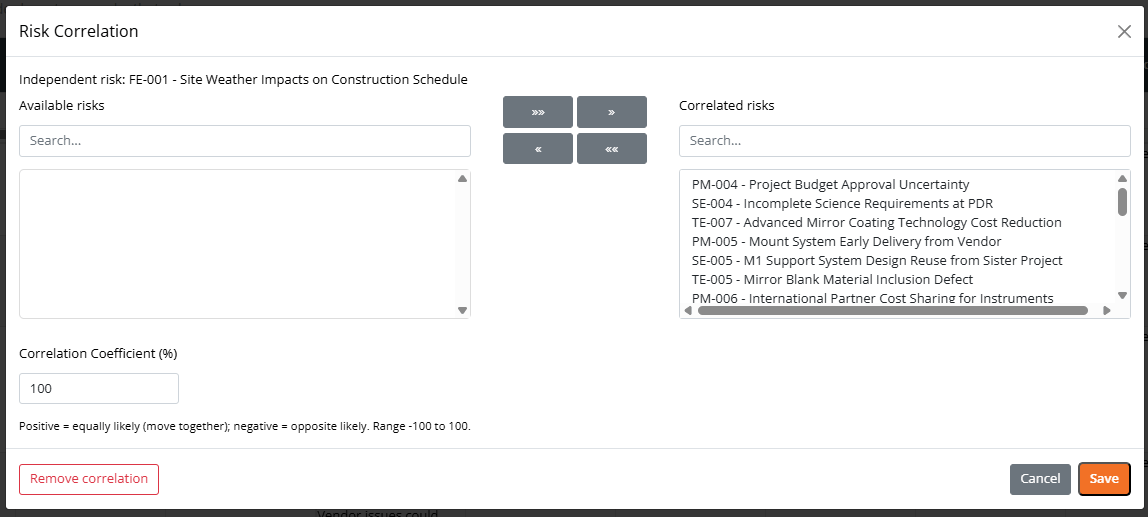 **Where:** the **Correlation** column on the Risk Register grid.
**What it is:** pick a driver risk, then select the risks that are correlated to it. Correlated risks share their random draws, so they tend to **occur in the same iterations**, and when they do, their **impacts tend to be large (or small) at the same time**. All three of a risk's draws are correlated: occurrence probability, cost impact, and schedule impact.
**Why you do it:** when risks share a common cause (the same vendor, the same technology, the same site condition), treating them as independent understates your true exposure. Correlating them restores the realistic "they tend to hit together" behavior.
**What it affects:** it widens the total cost and finish-date distributions. Because correlation acts on the shared draw before the impact is applied, it affects **both** the **Risk** (pre-mitigation) and **Mitigated Risk** (post-mitigation) result views, not just one of them.
**Availability:** This feature is only available in the Pro version.
### 3. Activity-to-Activity Correlation (Pro)
**Where:** the **Correlation** column on the Risk Register grid.
**What it is:** pick a driver risk, then select the risks that are correlated to it. Correlated risks share their random draws, so they tend to **occur in the same iterations**, and when they do, their **impacts tend to be large (or small) at the same time**. All three of a risk's draws are correlated: occurrence probability, cost impact, and schedule impact.
**Why you do it:** when risks share a common cause (the same vendor, the same technology, the same site condition), treating them as independent understates your true exposure. Correlating them restores the realistic "they tend to hit together" behavior.
**What it affects:** it widens the total cost and finish-date distributions. Because correlation acts on the shared draw before the impact is applied, it affects **both** the **Risk** (pre-mitigation) and **Mitigated Risk** (post-mitigation) result views, not just one of them.
**Availability:** This feature is only available in the Pro version.
### 3. Activity-to-Activity Correlation (Pro)
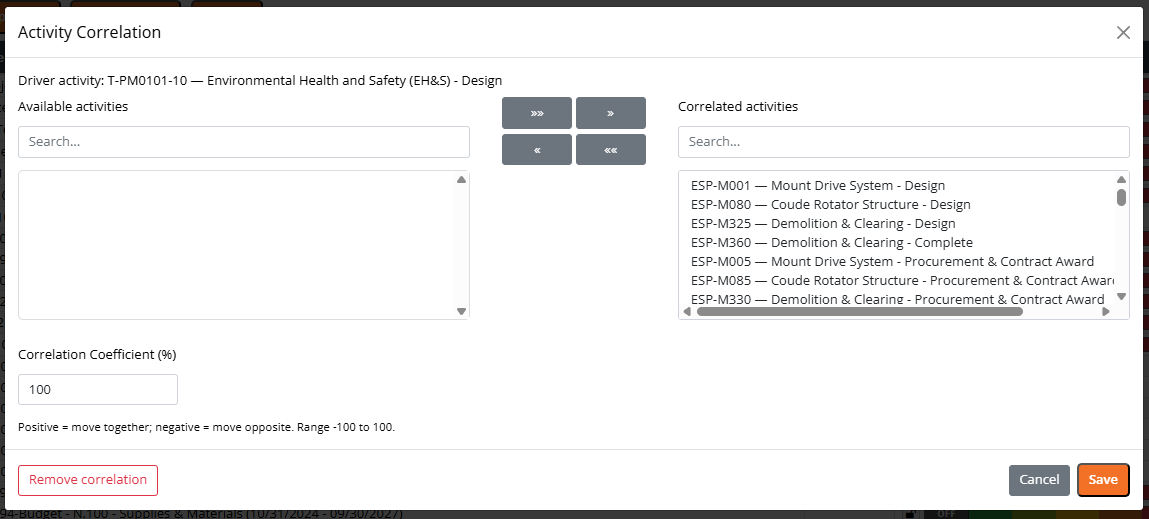 **Where:** the **Correlation** column on the Cost & Schedule Uncertainty tree (Risk Analysis page).
**What it is:** pick a driver activity, then select the activities that should follow it. Each iteration the follower activities inherit the driver's uncertainty draw, so they run long or short together. Because an activity's cost draw follows its schedule draw, correlated activities move together on **both** duration and cost.
**Why you do it:** activities that share a driver (the same crew, weather window, or supplier) genuinely tend to run long or short together. Correlating them captures that shared behavior instead of letting it cancel out.
**What it affects:** it widens the total cost and finish-date distributions.
**Availability:** This feature is only available in the Pro version.
***
## How they relate
The clearest way to hold all three in your head:
* **Correlation** changes **how big and how together** impacts are. It is always like-to-like (risk to risk, or activity to activity).
* **Mapping** changes **where** a risk's schedule impact lands (which activities absorb it).
They compose cleanly. A risk that correlation has made larger or more co-moving still lands on whatever activities its mapping specifies. Correlation decides the size and timing of the hit; mapping decides its destination on the schedule.
**Activity Mapping and Risk-to-Risk correlation are independent.** Editing a risk's mapped activities does not change any correlation between that risk and another risk, and adding or removing a correlation does not change a risk's activity mapping. Mapping only reroutes where a risk's (possibly correlated) schedule impact is applied.
### Side-by-side comparison
| | Activity-to-Risk Mapping | Risk-to-Risk Correlation | Activity-to-Activity Correlation |
| ------------------------------ | ----------------------------------------------------- | ------------------------------------------------------- | -------------------------------------------------- |
| **Family** | Routing | Correlation | Correlation |
| **Where** | Add/Edit Risk form | Risk Register grid | Cost & Schedule Uncertainty tree |
| **Links / routes** | One risk to its schedule activities | One risk to other risks | One activity to other activities |
| **Purpose** | Send a risk's schedule impact to the right activities | Make related risks occur and size together | Make related activities run long or short together |
| **Affects in the Monte Carlo** | Where a risk's schedule delay is applied | Total cost and finish spread (Risk and Mitigated views) | Total cost and finish spread |
| **Uses a coefficient** | No (uses weights) | Yes (-100% to +100%) | Yes (-100% to +100%) |
| **Pro feature** | No | Yes | Yes |
***
## When to use each
* **Map a risk to activities** whenever the risk has a schedule impact and you know which activities it delays. Without a mapping, the delay is applied to the project finish instead of to a specific activity, and the risk will not appear in the Activity Drivers chart.
* **Correlate risks** when two or more risks share a common cause and would realistically hit together. Independent risks understate the P80 and P90 you need for contingency.
* **Correlate activities** when two or more activities share a driver (crew, weather, vendor) and would realistically run long or short together.
***
## Frequently asked questions
No. Correlation is applied to each risk's random draws before any impact is calculated, so it affects **both** result views: the **Risk** graph (pre-mitigation) and the **Mitigated Risk** graph (post-mitigation). You can also set correlations on risks whether or not they are mitigated.
No. These are two separate features. **Risk-to-Risk correlation** links one risk's uncertainty to another risk's uncertainty; it is always risk-to-risk. **Activity Mapping** links a single risk to the schedule activities its impact should land on; it is routing, not correlation. There is no risk-to-activity correlation in Dash360, so you cannot correlate a risk directly to an activity.
There is no dedicated per-activity view of correlation impact. Correlation's effect shows up in the **aggregate** Monte Carlo output: wider tails and higher P80 and P90 on both cost and finish, plus shifts in the sensitivity or tornado view. The clearest way to see it is to run the simulation with correlation and again without it, then compare the percentiles.
No. Mapping and correlation are independent. Changing the mapped activities on a risk only changes **where** that risk's schedule impact lands; it does not change any Risk-to-Risk correlation the risk participates in. Likewise, adding or removing a correlation does not change the risk's mapping.
Not in this release. Each activity or risk can belong to only one correlation group, and an item cannot be both a driver and a follower at the same time.
***
## Related pages
* [Risk Register](/user-guide/risk/risk-register): the Activity Mapping section and the Risk Correlation column.
* [Risk Analysis](/user-guide/risk/risk-analysis): the Cost & Schedule Uncertainty tree and Activity Correlation.
* [How the Dash360 Monte Carlo Works](/user-guide/concepts/monte-carlo-methodology#correlation-pro): the underlying copula math and how correlation enters the simulation.
**Where:** the **Correlation** column on the Cost & Schedule Uncertainty tree (Risk Analysis page).
**What it is:** pick a driver activity, then select the activities that should follow it. Each iteration the follower activities inherit the driver's uncertainty draw, so they run long or short together. Because an activity's cost draw follows its schedule draw, correlated activities move together on **both** duration and cost.
**Why you do it:** activities that share a driver (the same crew, weather window, or supplier) genuinely tend to run long or short together. Correlating them captures that shared behavior instead of letting it cancel out.
**What it affects:** it widens the total cost and finish-date distributions.
**Availability:** This feature is only available in the Pro version.
***
## How they relate
The clearest way to hold all three in your head:
* **Correlation** changes **how big and how together** impacts are. It is always like-to-like (risk to risk, or activity to activity).
* **Mapping** changes **where** a risk's schedule impact lands (which activities absorb it).
They compose cleanly. A risk that correlation has made larger or more co-moving still lands on whatever activities its mapping specifies. Correlation decides the size and timing of the hit; mapping decides its destination on the schedule.
**Activity Mapping and Risk-to-Risk correlation are independent.** Editing a risk's mapped activities does not change any correlation between that risk and another risk, and adding or removing a correlation does not change a risk's activity mapping. Mapping only reroutes where a risk's (possibly correlated) schedule impact is applied.
### Side-by-side comparison
| | Activity-to-Risk Mapping | Risk-to-Risk Correlation | Activity-to-Activity Correlation |
| ------------------------------ | ----------------------------------------------------- | ------------------------------------------------------- | -------------------------------------------------- |
| **Family** | Routing | Correlation | Correlation |
| **Where** | Add/Edit Risk form | Risk Register grid | Cost & Schedule Uncertainty tree |
| **Links / routes** | One risk to its schedule activities | One risk to other risks | One activity to other activities |
| **Purpose** | Send a risk's schedule impact to the right activities | Make related risks occur and size together | Make related activities run long or short together |
| **Affects in the Monte Carlo** | Where a risk's schedule delay is applied | Total cost and finish spread (Risk and Mitigated views) | Total cost and finish spread |
| **Uses a coefficient** | No (uses weights) | Yes (-100% to +100%) | Yes (-100% to +100%) |
| **Pro feature** | No | Yes | Yes |
***
## When to use each
* **Map a risk to activities** whenever the risk has a schedule impact and you know which activities it delays. Without a mapping, the delay is applied to the project finish instead of to a specific activity, and the risk will not appear in the Activity Drivers chart.
* **Correlate risks** when two or more risks share a common cause and would realistically hit together. Independent risks understate the P80 and P90 you need for contingency.
* **Correlate activities** when two or more activities share a driver (crew, weather, vendor) and would realistically run long or short together.
***
## Frequently asked questions
No. Correlation is applied to each risk's random draws before any impact is calculated, so it affects **both** result views: the **Risk** graph (pre-mitigation) and the **Mitigated Risk** graph (post-mitigation). You can also set correlations on risks whether or not they are mitigated.
No. These are two separate features. **Risk-to-Risk correlation** links one risk's uncertainty to another risk's uncertainty; it is always risk-to-risk. **Activity Mapping** links a single risk to the schedule activities its impact should land on; it is routing, not correlation. There is no risk-to-activity correlation in Dash360, so you cannot correlate a risk directly to an activity.
There is no dedicated per-activity view of correlation impact. Correlation's effect shows up in the **aggregate** Monte Carlo output: wider tails and higher P80 and P90 on both cost and finish, plus shifts in the sensitivity or tornado view. The clearest way to see it is to run the simulation with correlation and again without it, then compare the percentiles.
No. Mapping and correlation are independent. Changing the mapped activities on a risk only changes **where** that risk's schedule impact lands; it does not change any Risk-to-Risk correlation the risk participates in. Likewise, adding or removing a correlation does not change the risk's mapping.
Not in this release. Each activity or risk can belong to only one correlation group, and an item cannot be both a driver and a follower at the same time.
***
## Related pages
* [Risk Register](/user-guide/risk/risk-register): the Activity Mapping section and the Risk Correlation column.
* [Risk Analysis](/user-guide/risk/risk-analysis): the Cost & Schedule Uncertainty tree and Activity Correlation.
* [How the Dash360 Monte Carlo Works](/user-guide/concepts/monte-carlo-methodology#correlation-pro): the underlying copula math and how correlation enters the simulation.