Overview
The Variance Narrative Report is a dedicated workspace for writing and reviewing variance explanations. It shows your earned value metrics alongside color-coded variance cells that indicate where narratives are required, flagged, or complete. The page supports two workflows for authoring narratives: clicking a variance cell opens the same modal used on the CPR, or you can switch to Edit Mode for in-page authoring with textarea fields for all four variance types at once. When all narratives are complete, an administrator exports them via Admin > Import/Export > Export > Variance Narrative Entries for inclusion in client deliverables or contract reporting packages. URL:/EarnedValue/NewVarianceNarrativeReport/Index
Prerequisites
- Select a project and reporting period. The grid does not load until both are selected.
- Earned value must have been calculated for the selected period.
- Variance thresholds must be configured by your administrator. Cells only turn red when a variance exceeds a configured threshold.
Page Layout
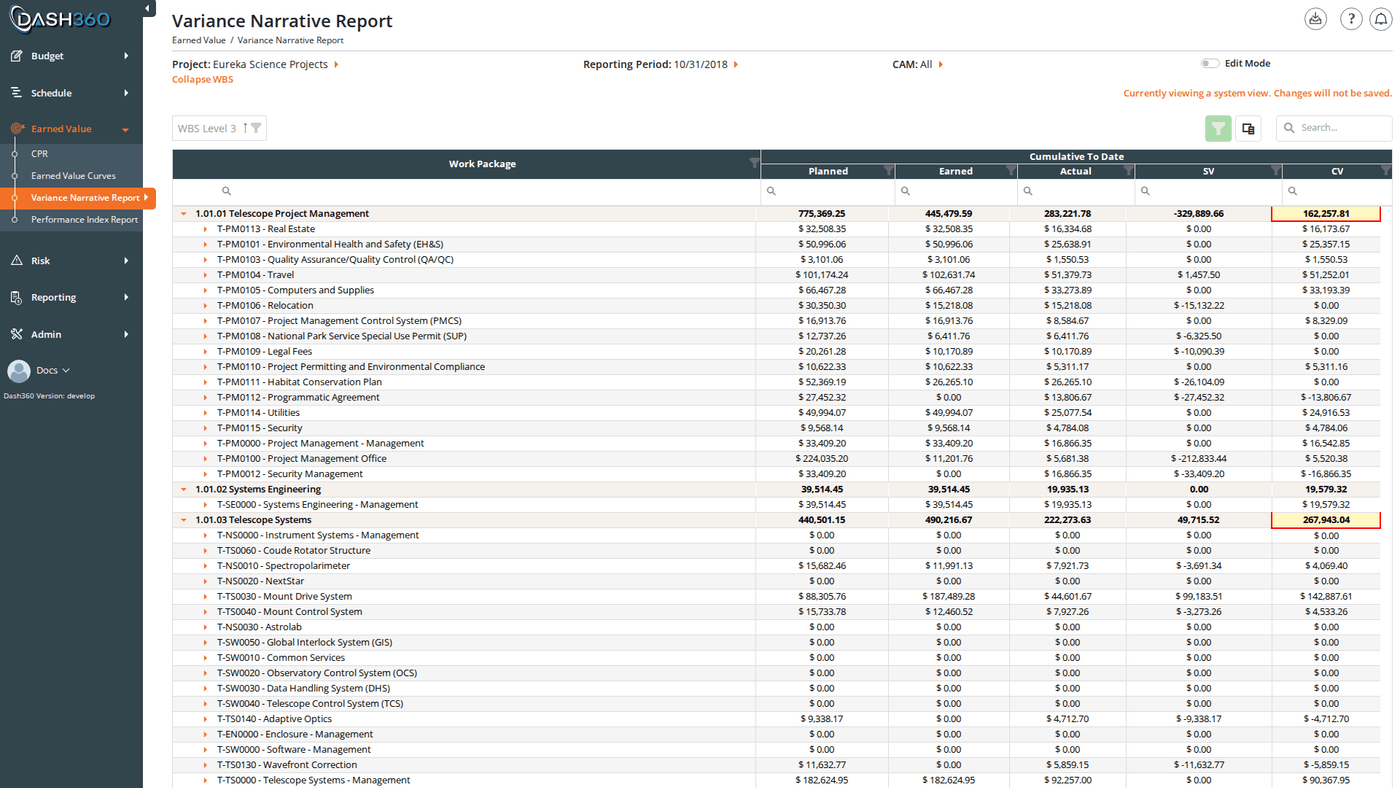
The page header contains three inline filters: Project, Reporting Period, and CAM. The Edit Mode toggle sits to the right of the CAM filter. Below the header, a Collapse/Expand WBS link toggles all group rows. The main grid fills the remainder of the page. When Edit Mode is active, a Save All button appears above and below the grid.Understanding the Color Coding
The four variance cells (Current Period SV, Current Period CV, Cumulative SV, and Cumulative CV) are color-coded on both data rows and group summary rows:On a locked project, variance cells are not color-coded and are not clickable. Attempting to save on a locked project returns an error.
Reading the Grid
Default Columns
By default, the grid groups rows by WBS Level 3 and shows:- Work Package: the work package code and description
- Cumulative To Date column group: Planned (BCWS), Earned (BCWP), Actual (ACWP), SV, CV
Available Hidden Columns
These columns are hidden by default. Add them via the column chooser in the grid toolbar:Viewing Narratives in Read Mode
In read mode (Edit Mode off), rows that have saved variance narratives display an expand arrow. Click the arrow to expand the master detail row and see the saved narrative text, organized into sections:- CURRENT PERIOD: COST VARIANCE (CPCV)
- CURRENT PERIOD: SCHEDULE VARIANCE (CPSV)
- CUMULATIVE TO DATE: COST VARIANCE (CTDCV)
- CUMULATIVE TO DATE: SCHEDULE VARIANCE (CTDSV)
CAM Filter
The CAM inline filter in the page header limits the grid to work packages for a specific Control Account Manager.- Administrators see an “All” option plus every CAM on the project.
- Non-administrators see only their own CAM by default.
Writing Variance Narratives
There are two ways to write narratives on this page. Use whichever fits your workflow.Method 1: Click a Variance Cell (Modal)
This opens the same Edit Variance Narratives modal used on the CPR report.- Click any red-bordered or yellow-bordered SV or CV cell on a data row or group summary row.
- The modal opens with the matching tab (Current Period or Cumulative to Date) and accordion (Schedule Variance or Cost Variance) pre-selected.
- Write your explanations in the narrative fields. Each field is a configurable named entry (for example, Cause, Impact, Corrective Action); the specific fields and which are required are set by your administrator.
- Click Save & Close. The cell border turns green once all required fields are saved.
Method 2: Edit Mode (In-Page Authoring)
Edit Mode expands all rows and displays textarea fields inline, letting you write narratives for multiple work packages without opening a modal.- Toggle the Edit Mode switch in the page header. All rows expand and the Save All button appears.
- For each work package row, four narrative sections appear below the data row:
- CURRENT PERIOD: COST VARIANCE (CPCV)
- CURRENT PERIOD: SCHEDULE VARIANCE (CPSV)
- CUMULATIVE TO DATE: COST VARIANCE (CTDCV)
- CUMULATIVE TO DATE: SCHEDULE VARIANCE (CTDSV)
- Each section contains one textarea per configured narrative field. Type your explanation into the fields.
- When you have finished writing, click Save All. A success message confirms how many records were created, updated, and deleted. Cell borders update to green for work packages where all required fields are now complete.
- Toggle Edit Mode off to return to read mode. The grid collapses back to its normal grouped view.
Narrative fields and which ones are required are configured by your administrator. The field names visible in Edit Mode (for example, Cause, Impact, Corrective Action) depend on your project’s configuration.
Deleting a Narrative
In Edit Mode, clear the text from a narrative textarea and click Save All. The save process treats empty fields as deletions; the success message will show the count of records deleted. Deleting all required narratives for a variance cell returns it to red status.Send Variance Narratives to My Admin
A Send Variance Narratives to My Admin button is available in certain project configurations. Clicking it sends the current variance narrative entries for the selected project and reporting period to the project administrator. Use this after completing your narratives to notify the admin they are ready for review.VN Filters Panel
Click the filter icon to open the left-side VN Filters panel. It contains two sections that activate after a project and reporting period are selected.Variance Narratives
Currency Format
Saved Views
The Variance Narrative Report supports named saved views that preserve your column layout, filters, sorts, and grouping. A System View loads by default.When viewing a system view, the message “Currently viewing a system view. Changes will not be saved.” appears at the top right of the grid.
- User views are saved per-user and visible only to you.
- System views are created by administrators and available to all users.