Schedule Viewer

Overview

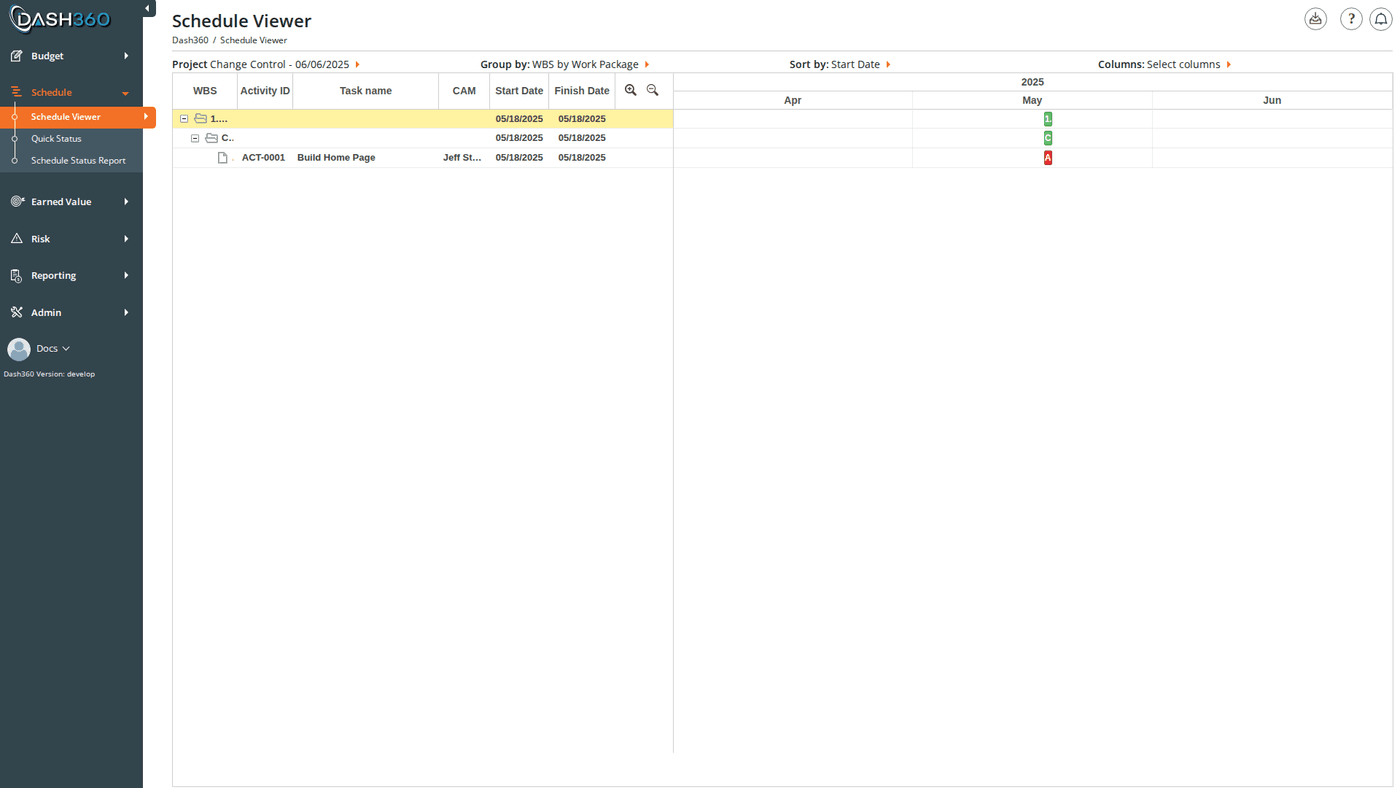
The Schedule Viewer is the primary place to review your project’s schedule. It presents activities in a split layout: a task grid on the left and a Gantt timeline on the right. The timeline overlays multiple bar types so you can compare current dates against baseline, previous month, and resource assignment dates at a glance. The Schedule Viewer is read-only: you cannot drag bars or edit activity dates directly here. To edit schedule data, use the Schedule Builder. To submit status updates (revised start/finish dates, % complete, predecessor changes), use the Schedule Data tab in the bottom panel or the Quick Status page.
CAM users only see the activities assigned to their work packages. Administrators and project managers see all activities.

Prerequisites

  • Select a project from the project dropdown in the toolbar. The schedule does not load until a project is selected.
  • The project must have schedule activities imported or created.

Toolbar Controls

The toolbar at the top of the page contains all controls for configuring the view.
ControlWhat It Does
ProjectSelect the project to display. Changing projects reloads the entire schedule.
ColumnsOpens a dropdown with checkboxes for every available column. Check or uncheck columns to show or hide them. Click Show Values after checking Total Cost, Total Hours, or Baseline Total Cost; these columns require a server fetch to calculate values.
Group ByOpens a multi-select dropdown. Check any combination of grouping fields (WBS, Work Package, CAM, Cost Class, Total Float, WBS Level N, custom fields) to apply multi-level grouping. The active grouping is shown as breadcrumb text (e.g., “WBS by CAM”).
Sort ByOpens a dropdown listing all visible columns with a checkbox and an Ascending/Descending toggle per column. Supports multi-column sorting.
ViewsOpens the saved view selector (see Section Views).
Zoom In / Zoom OutButtons in the grid header area. Zoom in steps down (Year → Month → Week → Day); zoom out steps up.
ScaleDropdown to set the timeline scale directly: Day, Week, Month (default), or Year.
Collapse All / Expand AllToggles all group row nodes open or closed.
Toggle Task RelationshipsCheckbox to show or hide the dependency lines (arrows) connecting activities.
Baseline BarCheckbox to show or hide the baseline bar layer for all activities.
Previous Month BarCheckbox to show or hide the previous month bar layer.
Resources BarCheckbox to show or hide the resource assignment date bar layer.
Status Date MarkerCheckbox to show or hide the vertical status date marker line on the timeline.

Flyout Filter Panel

Click the filter icon or Filters button to open the left-hand flyout. All filters are multi-select unless noted. Filters update the Gantt immediately when changed. Click Clear to reset all filters.
FilterTypeWhat It Does
WBSMulti-selectLimit activities to one or more WBS elements
Work PackageMulti-selectLimit activities to specific work packages
CAMMulti-selectLimit activities to one or more Control Account Managers
Cost Class or Cost SetRadio + multi-selectToggle between filtering resource bars by Cost Class or by Cost Set, then pick one or more values; click Go! to reload
Total FloatMulti-selectShow only activities with specific float values
Activity IDsMulti-selectShow only specific activities by Activity ID
ResourcesMulti-selectShow only activities that have resource assignments from selected resource codes
Start DateDateHide activities that start before this date
End DateDateHide activities that end after this date
WBS Level 1–NMulti-selectOne filter per WBS hierarchy level, dynamically generated based on the project’s WBS depth
Custom FieldsMulti-selectOne filter per custom field defined for the project, dynamically generated
Open EndsDropdownShow All (default), Show Open Ends (no predecessors and no successors), Show No Predecessors, Show No Successors
Critical PathRadioShow: highlight critical path in red (default). Show Only: hide non-critical activities. Hide: turn off critical path highlighting entirely
Displayed TasksRadioAll (default), No Resources (activities with no resource assignments), Misaligned (activity dates don’t match resource dates), Aligned (activity and resource dates match)
The Misaligned filter is especially useful for identifying activities where resource assignments don’t span the same dates as the scheduled activity; a common sign of stale resource data.

Task Grid Columns

All columns are optional (hidden or shown via the Columns dropdown) except the WBS tree column, which always appears. Columns that require a server call are noted.
ColumnDescription
WBSActivity ID and name combined in the tree hierarchy column
Work PackageWork package code and name
Activity IDThe activity’s unique identifier
Task NameThe activity name only
CAMControl Account Manager (label may differ based on registry setting)
Cost ClassCost class(es) of the resource assignments on this activity
Start DateCurrent scheduled start date
Finish DateCurrent scheduled finish date
DurationScheduled duration in working days
% CompletePhysical percent complete
FloatTotal float value
Total SlackTotal slack (may differ from float depending on schedule logic)
Free SlackFree slack: days the activity can slip without delaying its direct successor
WeightWork package weight value
Total HoursSum of resource assignment hours (requires Show Values)
Total CostSum of resource assignment costs across all loaded cost classes (requires Show Values)
Baseline Start DateStart date from the baseline schedule
Baseline Finish DateFinish date from the baseline schedule
Baseline Total CostBaseline cost total (requires Show Values)
Previous Month Start DateScheduled start date as of last month’s status
Previous Month Finish DateScheduled finish date as of last month’s status
Resources Start DateEarliest start date across all resource assignments on this activity
Resources Finish DateLatest finish date across all resource assignments on this activity
WBS Level 1–NOne column per WBS hierarchy level, dynamically generated
Custom FieldsOne column per custom field defined for the project
Total Hours, Total Cost, and Baseline Total Cost columns display dashes until you click Show Values in the Columns dropdown. This triggers a server request to calculate the values.

Timeline Bars

The Gantt timeline displays up to four overlapping bar layers per activity. Each layer is independently toggled via the checkboxes in the toolbar.
BarColorWhat It Shows
CurrentBlue (default)Current scheduled start and finish dates
BaselineGray/darkOriginal planned start and finish dates
Previous MonthOrange/amberStart and finish dates from last month’s status
ResourceGreenSpan covered by resource assignments for this activity
Activities on the critical path are highlighted in red. Use the Critical Path filter to show only critical activities or to turn off highlighting entirely. Milestones (activities where the start date equals the finish date) are displayed as diamond markers on the timeline instead of bars. Status Date Marker: a vertical line on the timeline marking the project’s current status date. Toggle with the Status Date Marker checkbox. As you enable more bar layers, row height automatically adjusts to keep all bars visible without overlap.

Grouping

Click Group By in the toolbar to open the grouping dropdown. Check any combination of fields to apply multi-level grouping. Groups can be combined (e.g., WBS by CAM, CAM by WBS by Total Float). The current grouping is shown as breadcrumb text in the toolbar button. Available grouping fields: WBS, Work Package, CAM, Cost Class, Total Float, WBS Level 1–N (per hierarchy level), and any custom fields defined for the project. To remove grouping, uncheck all boxes.

Sorting

Click Sort By in the toolbar. Each column can be sorted Ascending or Descending. Check multiple columns for multi-level sorting; the order you check them determines priority. Click the Ascending/Descending link next to a column to toggle its direction.

Bottom Panel

Click any activity row in the grid to select it and open the bottom panel. The selected Activity ID and name appear in the status bar at the bottom of the Gantt. The bottom panel has three tabs and a separate Resources Pane mode (set via radio buttons).

Predecessors / Successors Tab

Two tables (one for predecessors, one for successors) showing all activities linked to the selected activity.
ColumnDescription
DrivingWhether this link is on the driving path
FloatTotal float of the linked activity
Activity IDActivity ID of the linked activity
Activity NameName of the linked activity
Start DateScheduled start of the linked activity
Finish DateScheduled finish of the linked activity
Link TypeRelationship type: FS (Finish-to-Start), SS (Start-to-Start), FF (Finish-to-Finish), or SF (Start-to-Finish)
LagLag days on the link
Click any row in the predecessors or successors table to jump directly to that activity in the Gantt; the view scrolls and selects it.

Schedule Data (Status Update) Tab

This tab allows you to submit a schedule status update for the selected activity. The update is held for administrator review on the Schedule Status Updates page before being applied.
FieldDescriptionRequired
Status DateDisplays the current project status date (read-only, for reference):
Actual / Expected Start DateThe actual start date (if started) or expected start dateYes
Actual / Expected Finish DateThe actual finish date (if complete) or expected finish dateYes
Activity DescriptionFree-text name or description for this activityNo
Activity DurationRevised duration estimateNo
% CompletePhysical percent complete, 0–100Yes
CommentsAny notes for the reviewerNo
Request Delete ActivityCheck to request that this activity be removed from the scheduleNo
Change Predecessor LogicOpens a modal to add or remove predecessor activity relationshipsNo
Change Successor LogicOpens a modal to add or remove successor activity relationshipsNo
Validation rules enforced before saving:
  • Start date, finish date, and % complete are all required.
  • Finish date must be after start date.
  • If start date is before the status date, % complete must be greater than 0.
  • If start date is after the status date, % complete must be 0.
  • If finish date is before the status date, % complete must be 100.
  • If finish date is after the status date, % complete must not be 100.
Click Save to submit. The update is sent to the administrator for review. If a pending update already exists for this activity (submitted this period but not yet approved), its values are pre-populated when you open the tab.
Checking Request Delete Activity disables all other fields and bypasses the validation rules above. The delete request is reviewed by an administrator before the activity is removed.

Steps Tab

Displays the activity steps defined for the selected activity as a read-only grid.
ColumnDescription
Step IDUnique identifier for the step
Step DescriptionDescription of what this step involves
WeightRelative weight of this step toward the overall activity % complete
% CompleteCurrent completion status of this step
Steps are defined on the Budget Form in the Schedule section.

Resource Pane

Select the Resources layout (radio button) to open the Resource Pane below the Gantt. This pane shows the time-phased resource costs for whatever activity is currently selected. Click any activity row to load its resource data into the pane. Resource Pane columns:
ColumnDescription
Resource CodeResource code identifier
Cost ClassCost class of the resource assignment
TotalSum of the resource costs across all periods that overlap the activity’s dates
Monthly columnsCost (or hours, or other result type) per month; green cells indicate the period overlaps the activity; empty cells indicate no overlap
Result Type dropdown: Switch between result types; Hours, Subtotal (all-in cost), Baseline Subtotal, and any custom resource results defined for the project. For Baseline Subtotal, the pane uses baseline dates to determine which periods to show.
The Resource Pane Cost Class filter comes from the Cost Class / Cost Set filter in the flyout; if you’ve selected a specific cost class in the filter, the Resource Pane reflects that selection. Default is Budget.

Section Views

The Schedule Viewer fully supports Section Views. A Section View saves your complete configuration; visible columns, column widths, grouping, sort order, bar visibility (baseline, previous month, resources, status date marker), timeline zoom level, bottom panel layout, active filters, and grid panel width; under a name so you can reload it instantly. What is saved in a Schedule View:
  • Column visibility and widths
  • Grouping fields (and their order)
  • Sort fields and directions
  • Bar visibility toggles (baseline, previous month, resources, status date marker)
  • Timeline zoom level (Day / Week / Month / Year)
  • Bottom panel layout (none / resources / predecessor-successor / schedule data / steps)
  • All active filter values
  • Grid panel width
System Views are created by administrators and available to all users. User Views are personal. Either type can be set as your Default View so it loads automatically every time you open the Schedule Viewer. To copy a System View into a User View (so you can make changes to it), click Copy next to any System View in the view selector. User Views can also be exported to a file and imported by other users.

Circular Dependencies

When schedule data loads, Dash360 checks for circular dependencies in the activity links. If any are detected, a modal appears listing each cycle with its Activity IDs and names. Resolve circular dependencies in the Schedule Builder by removing one of the links in each cycle.

When to Use This Page

ScenarioWhat to do
Review the current project scheduleLoad the project, use the default month scale, apply any WBS or CAM filters needed
Compare current schedule vs. baselineEnable Baseline Bar to see both bars per activity; add Baseline Start Date and Baseline Finish Date columns
Identify critical path activitiesCritical path is highlighted red by default; use the Critical Path filter → Show Only to isolate them
Find schedule-resource misalignmentUse Displayed Tasks → Misaligned to show only activities where resource dates don’t match activity dates
Check predecessor/successor logicClick an activity and open the Predecessors/Successors tab
Submit schedule status (CAM workflow)Click an activity, open the Schedule Data tab, enter revised dates and % complete, save
Review activity steps completionClick an activity and open the Steps tab
See resource cost breakdown for an activityEnable the Resources layout and click an activity
For bulk status update entry across many activities, the Quick Status page provides a more efficient grid-based interface than the activity-by-activity approach available here.