Risk Register

Overview

The Risk Register is the central workspace for identifying and managing project risks. It tracks each risk’s probability, cost and schedule impact, mitigation plans, and status throughout the project lifecycle. The register is organized into four collapsible sections: the main risk grid, heatmaps, Monte Carlo simulations, and burn down charts. URL: /Risk/RiskRegister/Index

Prerequisites

  • A project must be selected to view the Risk Register.
  • To add or edit risks, your account must have Full Access to the Risk module for the selected project. Accounts with Read-Only access can view risks but cannot make changes.
  • Risk ID Prefixes must be configured before adding risks. An administrator sets these up in Admin > Projects > Edit Project. Examples: PR-, SED-, RISK-.
  • Risk thresholds (Cost, Probability, and Schedule) must be configured for the project before the Add/Edit modal can be opened. If thresholds are missing, an error message appears and the modal does not open.
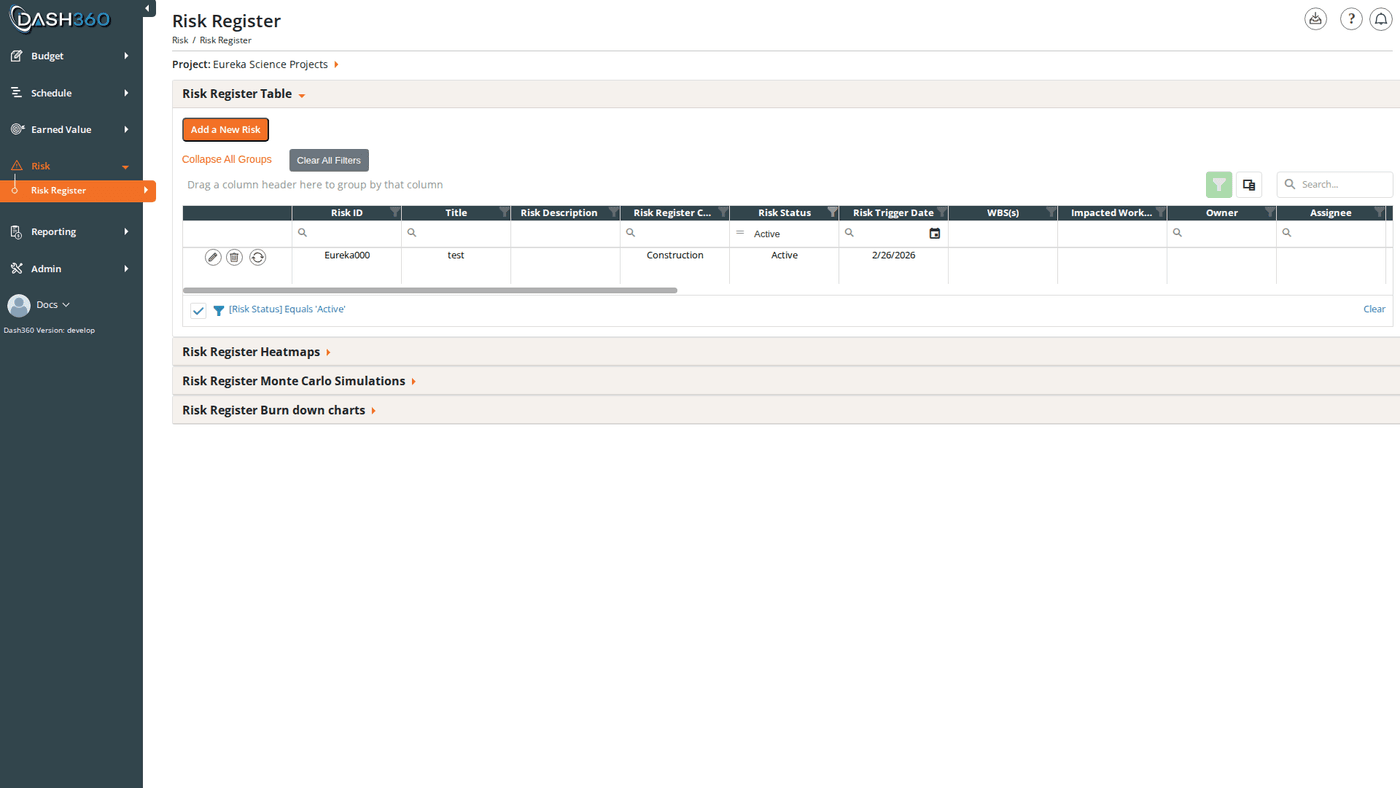
Risk Register Table

Status Filter

A Status multi-select dropdown appears above the grid. You can select one or more statuses to show simultaneously. The default is Active only. Changing the status filter also updates the heatmaps in the Risk Register Heatmaps section to match. Available status values:
StatusMeaning
ProposedRisk has been identified but not yet confirmed or actively tracked
ActiveRisk is confirmed and being actively monitored and mitigated
Realized (happened)The risk event occurred: it is now an issue
RetiredRisk is no longer relevant (mitigated, expired, or no longer applicable)
DeprecatedRisk was superseded or replaced by another risk item

Grid Columns

ColumnDescription
Risk IDThe unique identifier assigned at creation (e.g., PR-007)
TitleShort descriptive name for the risk
Risk DescriptionFull description of the risk
Risk Register CategoryThe category this risk belongs to
Risk StatusCurrent lifecycle status
Risk Trigger DateThe date at which the risk may be triggered or is expected to materialize
WBS(s)WBS elements associated with the risk
Impacted Work PackagesWork packages that would be affected if the risk occurs
OwnerThe person responsible for monitoring and managing the risk
AssigneeThe person assigned to execute the mitigation plan
ResponseThe planned risk response strategy
Mitigation PlanNarrative description of the mitigation plan
Mitigation StatusCurrent state of the mitigation effort
Cost ImpactEstimated cost if the risk occurs
ProbabilityLikelihood the risk occurs (shown as a percentage)
Total Cost ExposureCalculated: Cost Impact × Probability
Schedule ImpactEstimated schedule impact in days
Risk RankNumerical rank (1–5) assigned to the risk
ConsequenceNarrative description of the consequence if the risk occurs
[Notebook Fields]One column per configured notebook field for this project
Date CreatedWhen the risk was first created
Last UpdatedWhen the risk was most recently edited

Row Actions

Each row has four action buttons:
ButtonAction
Edit (pencil icon)Opens the Add/Edit modal pre-filled with this risk’s data
Delete (trash icon)Deletes the risk after confirmation
History (clock icon)Opens the history for this risk. Only visible when History Tracking is enabled in the project registry.
Process icon (gear icon)Opens a dropdown with Rename Risk ID and Copy Risk

Toolbar Controls

Above the grid:
  • Add a New Risk: opens the Add/Edit modal to create a new risk
  • Expand All Groups / Collapse All Groups: toggles all grouped rows
  • Clear All Filters: removes all active grid filters

Add or Edit a Risk

Click Add a New Risk in the toolbar, or click the Edit icon on any existing risk row. Both open the Add/Edit Risk modal, which contains four collapsible sections.

Validation

The following fields are required. Saving without them shows an error and the modal does not close:
  • Risk ID Prefix (add only)
  • Title
  • Risk Category
  • Risk Type
  • Cost Impact
  • Probability
  • Schedule Impact

General Section

FieldDescriptionRequired
Risk ID PrefixSelect the prefix series for this risk (e.g., PR-). Disabled when editing.Yes (add only)
Risk IDAuto-populated with the next sequential ID when a prefix is selected. Disabled when editing.:
TitleShort descriptive name for the riskYes
Risk CategoryClassification category configured by your administratorYes
Risk TypeSub-classification typeYes
StatusCurrent lifecycle status. Defaults to Proposed for new risks.Yes
Trigger DateThe date the risk may be triggered or expected to materializeNo
Risk DescriptionFull narrative description of the riskNo
WBS(s)Multi-select: choose one or more WBS elements affected by this riskNo
Impacted Work Package(s)Multi-select: choose one or more work packages that would be impactedNo
OwnerPerson responsible for managing this riskNo
AssigneePerson responsible for executing the mitigation planNo
Risk IDs are assigned sequentially at save time and cannot be manually entered on a new risk. The Risk ID and Risk ID Prefix fields are locked (disabled) when editing an existing risk. To change a Risk ID, use Rename Risk ID from the process icon menu.

Notebook Fields Section

Contains custom fields configured for your project’s risk register. Field types include text, textarea, rich text (WYSIWYG), date, radio buttons, checkboxes, dropdown, code file, and CAM. This section is empty if no notebook fields have been configured.

Mitigations & Timeline Section

FieldDescription
Risk ResponseThe planned response strategy (e.g., Mitigate, Accept, Transfer, Avoid)
Risk Mitigation PlanNarrative description of how this risk will be mitigated
Risk Mitigation StatusCurrent progress on the mitigation effort

Risk Impact Section

This section uses threshold dropdowns as a quick-entry aid: selecting a threshold range from the dropdown automatically fills the corresponding numeric field with the threshold’s boundary value. You can always override the auto-filled value manually.
FieldDescriptionRequired
Cost Impact ThresholdsDropdown of configured cost threshold ranges (e.g., “$0–$100K - Low”). Selecting one pre-fills Cost Impact.No
Cost Impact ($)The estimated cost if the risk occursYes
Probability ThresholdsDropdown of configured probability ranges (e.g., “10%–25% - Low”). Selecting one pre-fills Probability.No
Probability (%)The likelihood the risk occurs (0–100)Yes
Schedule Impact ThresholdsDropdown of configured schedule ranges (e.g., “0–30 Days - Low”). Selecting one pre-fills Schedule Impact.No
Schedule Impact (Days)Estimated schedule impact in daysYes
Total Cost ExposureRead-only. Auto-calculated: Cost Impact × Probability (as a decimal). Updates whenever Cost Impact or Probability changes.:
ConsequenceNarrative description of what happens if the risk occursNo

Save Options

  • Save & Close: saves the risk and closes the modal
  • Save & Add Another: saves the risk, resets the form, and keeps the modal open (only available when adding a new risk, hidden when editing)

Rename a Risk ID

To assign a risk a different ID without losing any associated data:
  1. Click the process icon (gear icon) on the risk row.
  2. Select Rename Risk ID.
  3. In the modal, the Existing Risk ID Prefix and Existing Risk ID are shown as read-only.
  4. Select a New Risk ID Prefix: the New Risk ID field auto-populates with the next sequential ID for that prefix.
  5. Optionally edit the New Risk ID manually.
  6. Click Save & Close.

Copy a Risk

To create a new risk based on an existing one:
  1. Click the process icon (gear icon) on the risk row.
  2. Select Copy Risk.
  3. In the modal:
    • Select a Risk ID Prefix for the new risk; the Risk ID field auto-populates.
    • Enter a Title for the new risk.
  4. Click Copy & Close.
All data from the source risk is copied to the new risk. Edit the copy to adjust any fields as needed.

Delete a Risk

Click the Delete icon on the risk row and confirm.
Deleting a risk is permanent. All associated mitigation data, notebook entries, and simulation inputs are removed. Consider changing the status to Retired or Deprecated instead if you want to preserve history.

Risk Register Heatmaps

Click the Risk Register Heatmaps accordion to expand it. The section renders three heatmaps side by side, each plotting Probability on one axis against a risk dimension on the other axis:
HeatmapAxes
Cost RiskProbability × Cost Impact
Schedule RiskProbability × Schedule Impact
Risk RankingProbability × Risk Rank
Each cell shows the count of risks falling in that probability/impact range. Cells are color-coded:
  • Green: low combined exposure
  • Yellow: moderate combined exposure
  • Red: high combined exposure
Clicking any cell filters the Risk Register grid to show only the risks in that range. To clear the filter, click Clear All Filters above the grid. The heatmaps reflect whichever statuses are currently selected in the Status filter.
If risk thresholds have not been configured for the project, the heatmaps display a message prompting your administrator to complete the threshold setup.

Risk Register Monte Carlo Simulations

Expand the Risk Register Monte Carlo Simulations accordion. This section is only shown when there is at least one risk in the project.

Running a Simulation

  1. Set Simulation Iterations: the number of times to simulate the portfolio (must be between 10 and 50,000; default is 1,000).
  2. Click Run Monte Carlo simulation.
  3. A spline chart appears showing the cumulative cost distribution across all iterations. The x-axis is the simulation iteration index (0–1,000 by default); the y-axis is the total risk cost in dollars. Hover a point to see the dollar value.
The simulation runs against the risks currently visible in the grid based on the Status filter. Each iteration independently draws a random outcome for each risk (either the full Cost Impact if the random value falls within the probability, or zero).

Saving a Simulation

After running, a Simulation Title field and Save Simulation button appear below the chart.
  1. Enter a title for this simulation run.
  2. Click Save Simulation.
The simulation is saved and added to the Previous Simulations dropdown.

Viewing Previous Simulations

If saved simulations exist, a Previous Simulations dropdown appears at the top of the section. Select any saved simulation from the dropdown to reload its chart.

Risk Register Burn Down Charts

Expand the Risk Register Burn down charts accordion to see how risk exposure has changed over time.
This section is hidden for projects configured to hide burn down charts.

Burn Down Filters

FilterDescription
Risk ID PrefixFilter by risk prefix series
Risk CategoryFilter by category
Risk IDFilter to a specific risk item
WBSFilter by WBS element
Impacted Work PackagesFilter by work package
OwnerFilter by risk owner
AssigneeFilter by risk assignee
Changing any filter refreshes the charts automatically.

Charts

Two charts are displayed:
  • Cost Burn Down: total risk cost exposure over time
  • Schedule Burn Down: total schedule impact exposure over time

Saved Views

The Risk Register supports named saved views that preserve your column layout, grouping, filters, and sort settings.
When viewing a system view, changes to the grid layout are not saved. Switch to a user view to save your preferences.

Grid Features

FeatureDescription
Expand/Collapse All GroupsLink above the grid. Toggles all group rows.
Clear All FiltersButton above the grid. Removes all active grid filters including heatmap-applied filters.
Column chooserAdd or hide columns including notebook field columns.
Search panelFree-text search across all visible columns
Filter rowPer-column filter inputs; click Apply Filters to apply
Header filterClick any column header for value-based filtering
Filter panelShows active filter criteria and allows clearing them
Group panelDrag columns to add additional grouping levels
Context menuRight-click a group row to expand or collapse it individually

Exporting

Click the Download icon in the page header and select Export as Excel. The file is saved as RiskRegister.xlsx and includes:
SheetContents
Risk RegisterThe current grid data as displayed
Heat MapThe three heatmap tables with color coding preserved
Monte CarloThe Monte Carlo simulation chart image (only included if a simulation chart is currently displayed)