Compare Cost Classes

Overview

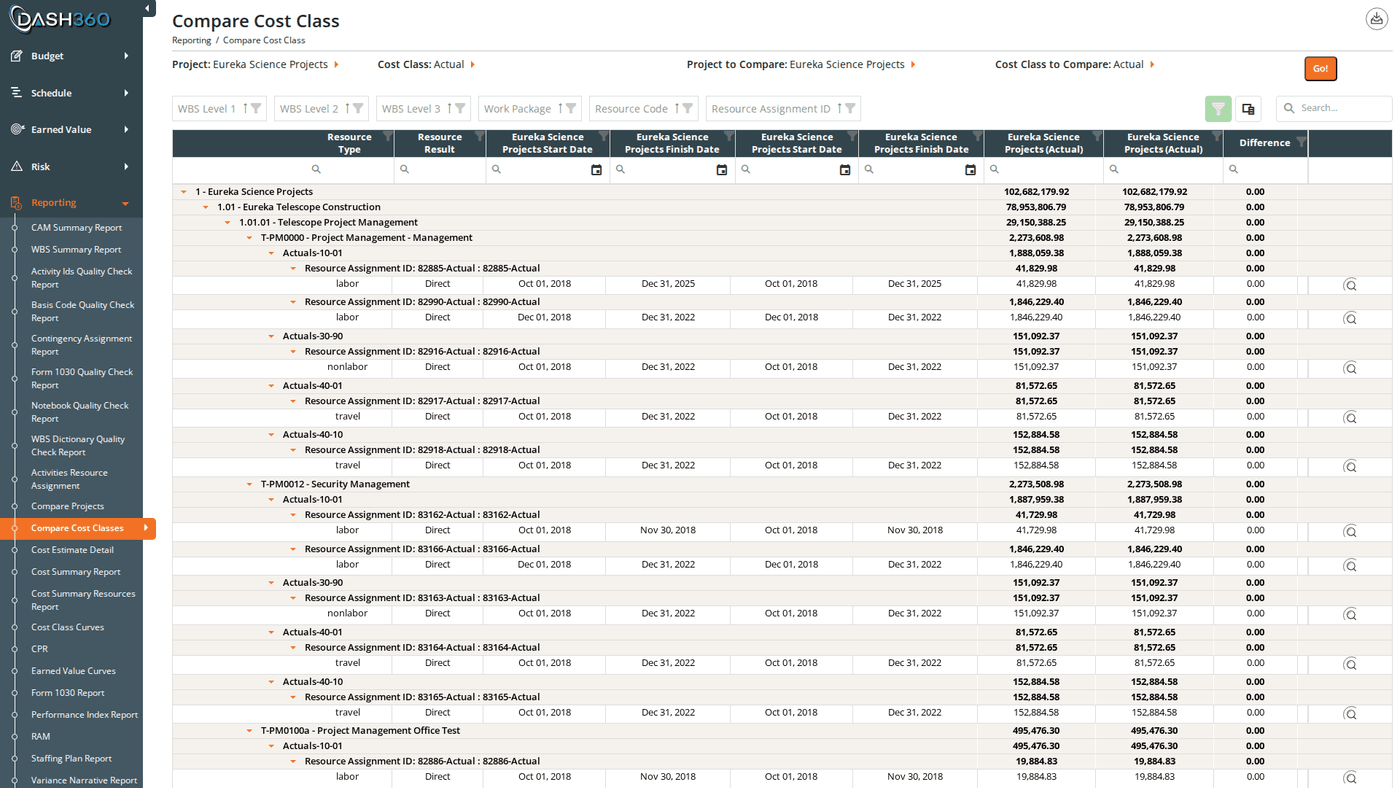
Compare Cost Classes lets you select a specific cost class from each of two projects and compare them resource assignment by resource assignment. The grid shows your WBS hierarchy down to the resource assignment level, with one column for each cost class and a Difference column. The most common use case is comparing a project’s Budget against its Actual cost. But you can compare any two cost classes from any two projects; including cross-project benchmarks. URL: /Reporting/CompareCostClasses/Index

Prerequisites

  • Select two projects and a cost class from each, then click Compare. The grid does not load until all four selections are made and Compare is clicked.
  • The cost class dropdowns are project-specific; each dropdown lists only the cost classes available for the project selected in the corresponding project filter.

Filters

FilterWhat It Controls
Project 1The first project to include in the comparison
Cost Class 1Which cost class to use from Project 1 (e.g., Budget). Options update when Project 1 is selected.
Project 2The second project (can be the same project as Project 1)
Cost Class 2Which cost class to compare from Project 2 (e.g., Actual). Options update when Project 2 is selected.
Currency DivisorDisplay values in base dollars, thousands (K), or millions (M)
After selecting all four values, click Compare to load the grid. If any of the four selections is missing, an alert prompts you to complete the selection.
The cost class dropdowns only populate after a project is selected. If you change Project 1, the Cost Class 1 dropdown reloads with the new project’s cost classes.

Reading the Grid

Hierarchy

The grid is organized hierarchically:
WBS Level 1
  └── WBS Level 2
        └── WBS Level 3 (and deeper levels if configured)
              └── Work Package
                    └── Resource Code
                          └── Resource Assignment
The grid loads collapsed by default. Expand rows by clicking them, or use the Expand All Groups / Collapse All Groups link above the grid. Each group row shows summed totals for the two cost columns and the Difference column, so you can read roll-up comparisons at any level without expanding to the detail.

Columns

Fixed identifier columns (left side):
ColumnDescription
WBS Level 1–3WBS group columns, visible by default
WBS Level 4–9Hidden by default; add via the column chooser
Work PackageWork package group column
Resource CodeResource code group column
Resource Assignment IDHidden by default; add via the column chooser
Resource Code DescriptionHidden by default; add via the column chooser
Resource Assignment DescriptionHidden by default; add via the column chooser
Resource TypeThe type classification for this resource
Resource ResultThe result type (e.g., Labor Hours, FTEs, Travel)
[Project 1] Start DateStart date for the Project 1 resource assignment. Column header shows the actual project name.
[Project 1] Finish DateFinish date for the Project 1 resource assignment
[Project 2] Start DateStart date for the Project 2 resource assignment
[Project 2] Finish DateFinish date for the Project 2 resource assignment
Cost comparison columns (right side):
ColumnDescription
[Project 1] ([Cost Class 1])Cost from Project 1 using Cost Class 1. Column header shows the actual project and cost class names, plus the divisor label (e.g., ($K)).
[Project 2] ([Cost Class 2])Cost from Project 2 using Cost Class 2
DifferenceCost Class 2 minus Cost Class 1. A negative value means Cost Class 2 is lower than Cost Class 1.
ViewOpens the time-phased RA Detail pivot grid for this row (see below)

Time-Phased RA Detail

Click the View button on any resource assignment row to open the RA Detail pivot grid. This shows the cost comparison broken down by period. Modal header: “Resource Assignment ID: [ID from Project 1] / Compared to: [ID from Project 2]” Pivot structure:
  • Rows: Resource Assignment ID and Resource Result type
  • Columns: Fiscal Year → Quarter → Month (hierarchical; expand a year to see quarters, expand a quarter to see months)
  • Values: Cost for each period
  • Grand totals: Shown for both rows and columns
Use this view to identify exactly when in the project timeline a budget-versus-actual divergence occurred.

When to Use This Report

Use Compare Cost Classes when you need to:
  • Budget vs. Actual analysis: see where actual costs deviated from the approved budget at the resource assignment level.
  • Cross-period comparison: compare cost classes that represent different snapshots in time (e.g., Original Budget vs. Current Budget).
  • Cross-project benchmarking: compare the cost profile of one project’s cost class against a different project’s cost class.
  • Identify timing of variances: use the View button to drill into the monthly breakdown and find when a variance first appeared.

Saved Views

Compare Cost Classes supports named saved views that preserve your column layout, grouping, and filter settings. Use the view selector in the toolbar to save and reload your own named views.
When viewing a system view, the message “Currently viewing a system view. Changes will not be saved.” appears at the top right of the grid.

Grid Features

FeatureDescription
Expand/Collapse All GroupsLink above the grid. Toggles all group rows at once.
Column chooserAdd hidden columns: WBS Level 4–9, Resource Assignment ID, Resource Code Description, Resource Assignment Description
Search panelFree-text search across all visible columns
Filter rowPer-column filter inputs; click Apply Filters to apply
Header filterClick any column header for value-based filtering
Filter panelShows active filter criteria and allows clearing them
Group panelDrag columns to add additional grouping levels

Exporting

Click the Download icon and select Export as Excel. The file is saved as CompareCostClass.xlsx with the grid data on a sheet named Compare Cost Class.