Overview
Budget Reports are a collection of cost summary reports and quality check reports built from your project’s cost estimate data. Use them to review rolled-up costs at the WBS or CAM level, verify data completeness before a review, and confirm that supporting data (basis codes, notebook entries, activity IDs, Form 1030 mappings) is fully populated. Navigate to a report using the Report inline filter dropdown at the top of the page. Selecting a report updates the page title, filters, and data table in place. All reports require a project to be selected before loading.Common Features
Display Units
All cost reports support a Display Units filter that scales every dollar value in the report:Section Views
Section Views are saved column configurations. A Section View stores which columns are visible, their order, and any applied grouping or sorting; so you can switch between preset layouts without reconfiguring the grid manually.- System views are available to all users and are managed by administrators.
- User views are saved per-user from the current grid state.
Grid Features
Every report grid in Budget Reports includes:- Search panel: free-text search across all visible columns
- Filter row: per-column filter inputs with an Apply Filters button
- Header filters: click any column header to filter by specific values
- Filter panel: shows active filter criteria and allows clearing them
- Column chooser: add or remove columns using the column chooser button in the toolbar
- Column reordering: drag column headers to reorder
- Column fixing: right-click a column header to pin it to the left
- Group panel: drag columns to the group panel to group rows by that field
- Export to Excel: export button in the toolbar downloads the full report as an Excel file including all active filters
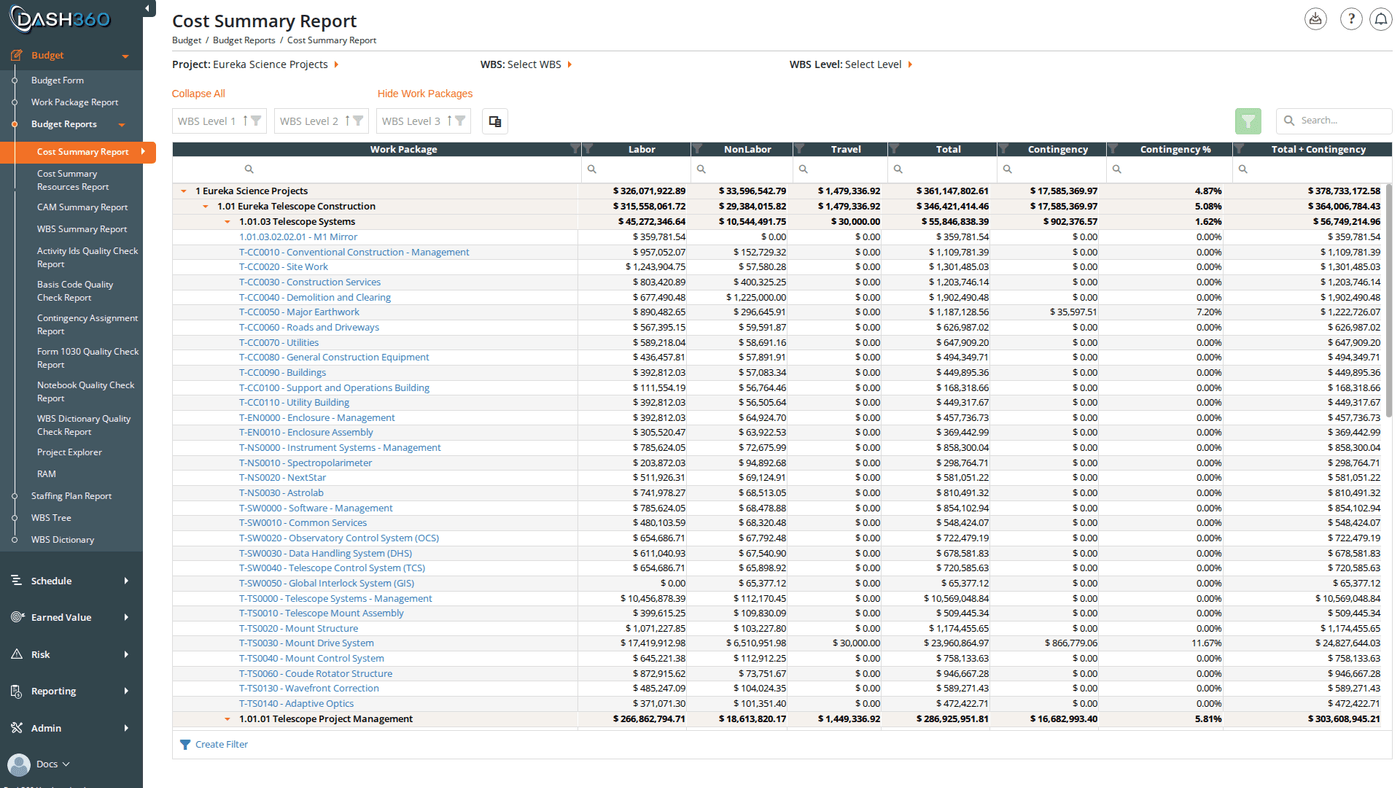
Cost Summary Report
Summarizes total estimated costs organized by WBS hierarchy. Each WBS level is shown with its rolled-up cost across all work packages below it. This is the primary report for reviewing the overall estimate structure and validating cost totals at each level.Filters
Columns
Always visible:
Time-phased columns (hidden by default, add via column chooser):
Resource Result columns (hidden by default):
Additional columns (hidden by default):
Cost Summary Resources Report
The same WBS cost hierarchy as the Cost Summary Report, but broken out by resource code and resource type within each work package. Use this when you need to see not just how much is estimated by WBS element, but which resources drive the cost at each level.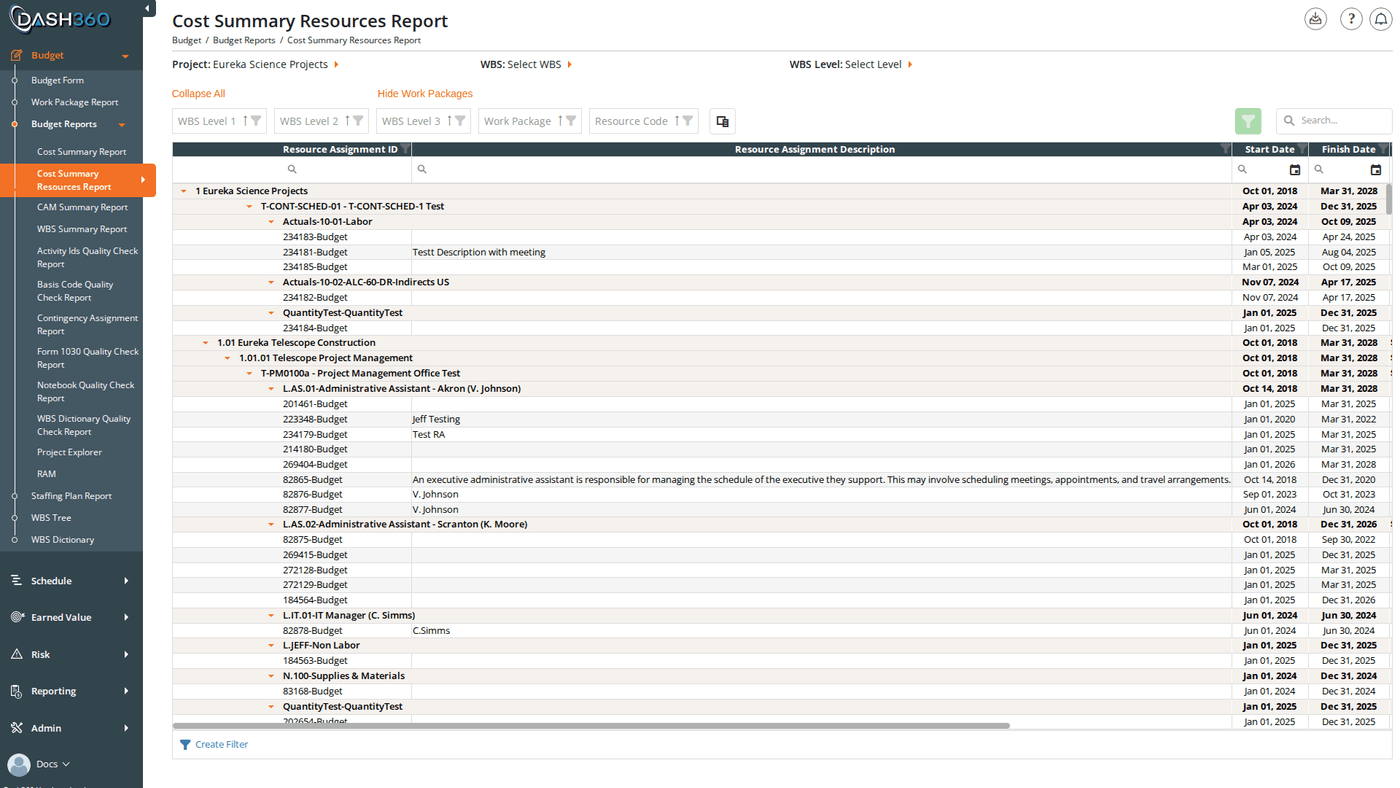
Filters
Same filters as the Cost Summary Report: Project, WBS, WBS Level, Cost Class (multi-select), Display Units, Calendar, Section Views.Columns
The same column structure as the Cost Summary Report, with the addition of:CAM Summary Report
Summarizes estimated costs organized by Control Account Manager (CAM) rather than by WBS. Use this when you need to review each CAM’s total scope and cost responsibility in one view. The report includes the same charts and tables as the WBS Summary Report (cost by estimate type (Parametric, Analogy, Engineering, etc.), cost by resource type (Labor, Non-Labor, Travel), cost by cost type, and FTE analysis) but grouped by CAM rather than WBS element.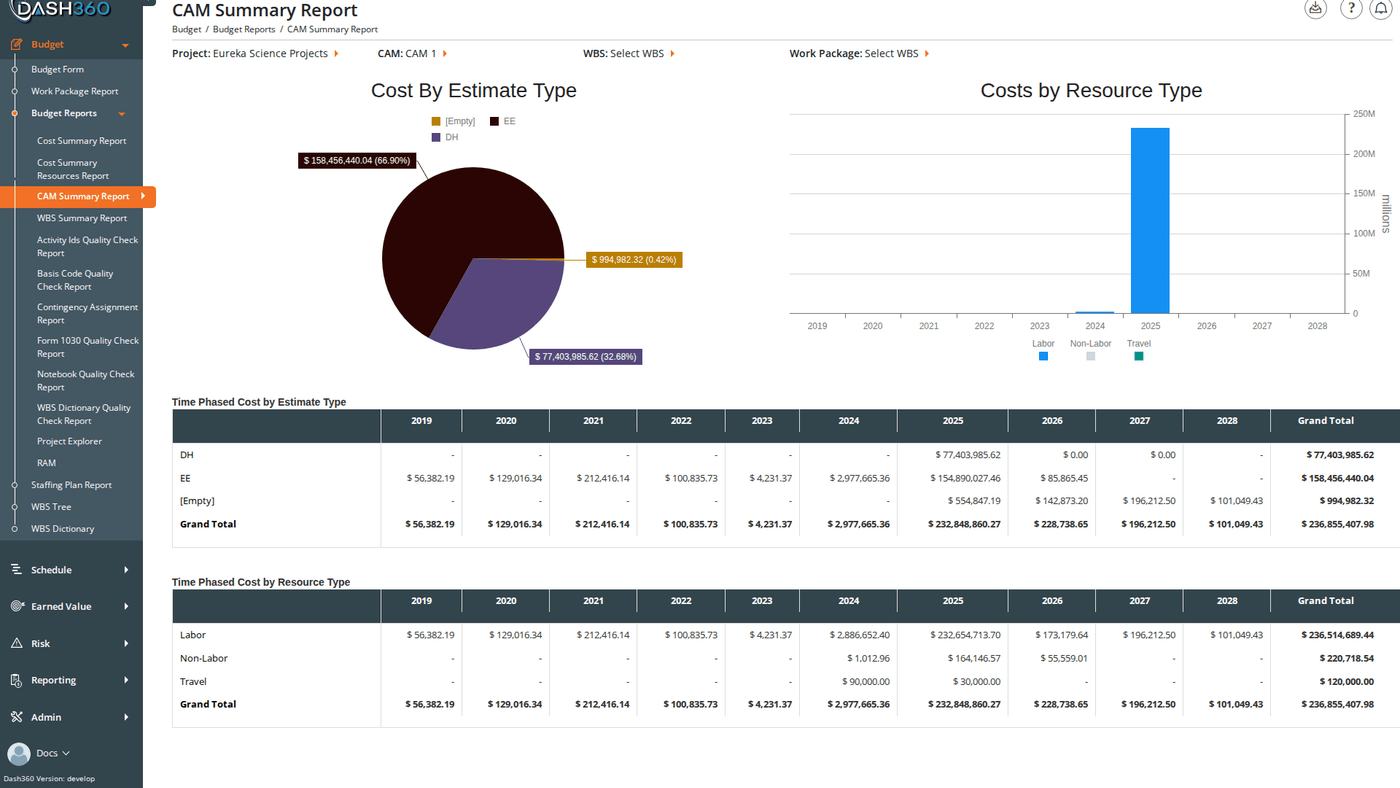
Filters
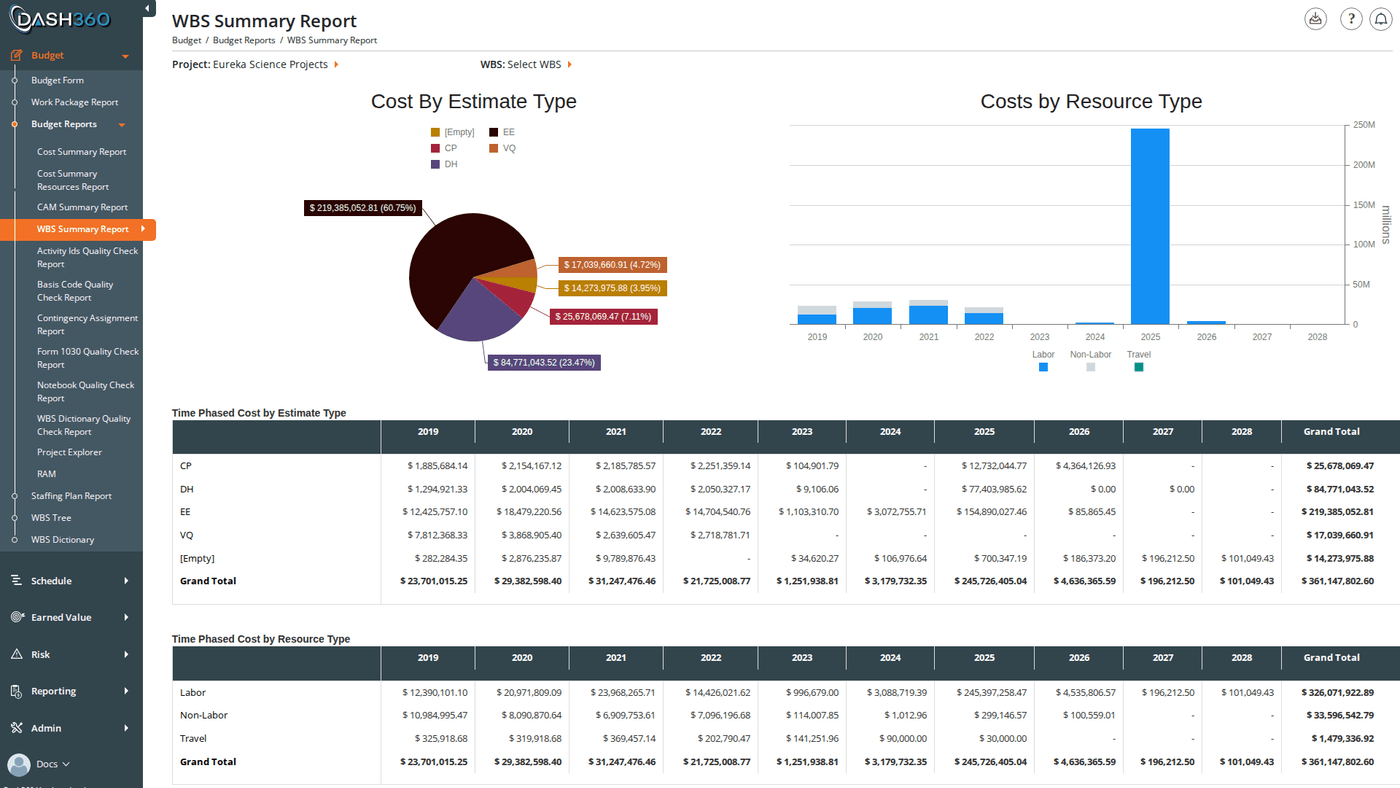
WBS Summary Report
A comprehensive visual summary of the project estimate broken down by WBS element. Includes multiple charts and supporting data tables:- Cost by Estimate Type: breaks down the estimate by methodology (Parametric, Analogy, Engineering, Grassroots, etc.)
- Cost by Resource Type: Labor, Non-Labor, Travel split
- Cost by Cost Type: breaks cost into configured cost types
- FTE Analysis: full-time equivalent labor across WBS elements
- Stacked cost subtotals: rolled-up totals at each WBS level
Filters
Activity IDs Quality Check Report
Lists every resource assignment in the project along with any activity IDs assigned to it, and validates whether those activity IDs exist in the project’s current task list. Use this report before a schedule-cost integration review to confirm that all RA-to-activity links are valid and no stale or missing IDs remain.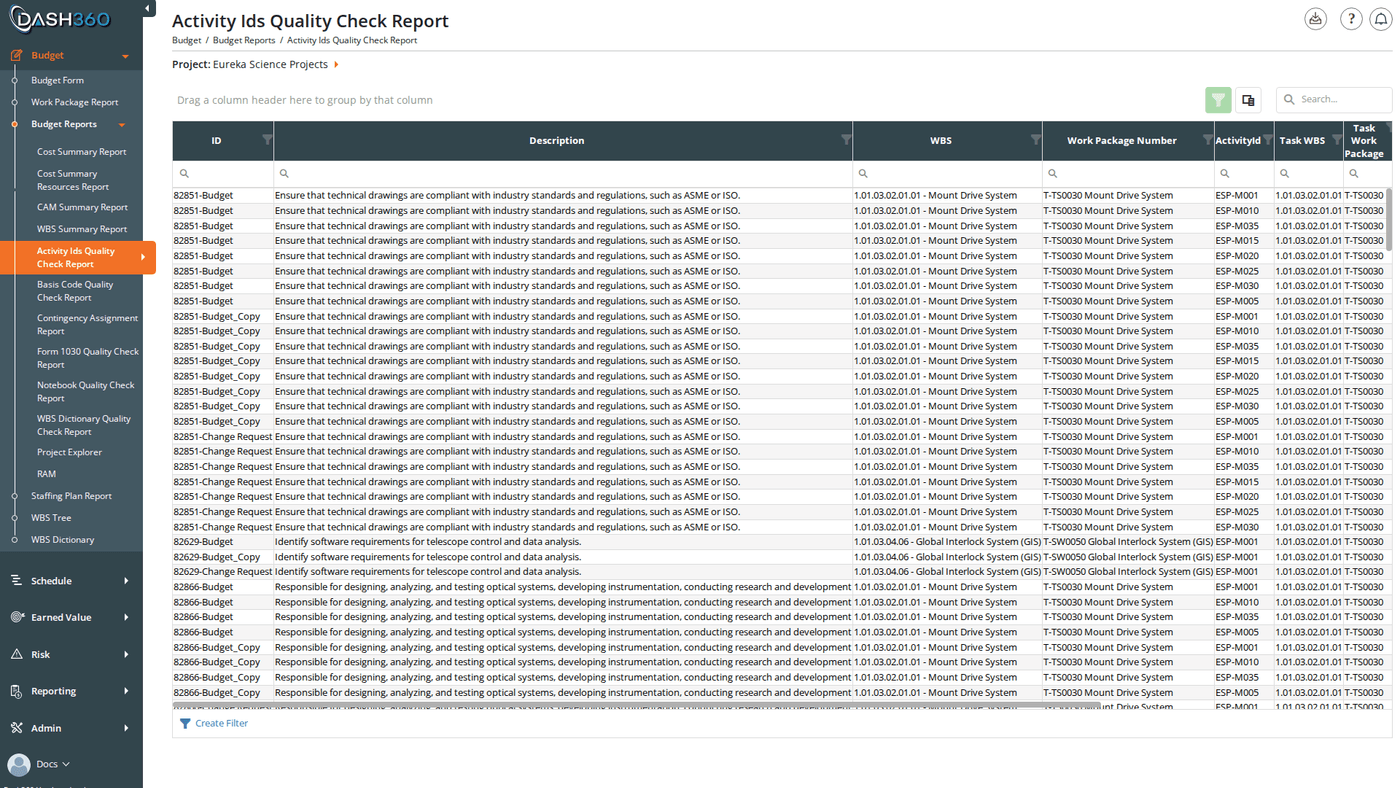
Filters
Columns
Rows where Valid = No indicate broken schedule links that need to be corrected on the Budget Form or via a schedule re-import.
Basis Code Quality Check Report
Lists all budget resource assignments and shows whether each one has a basis code assigned. Use this report to find gaps before a basis-of-estimate review.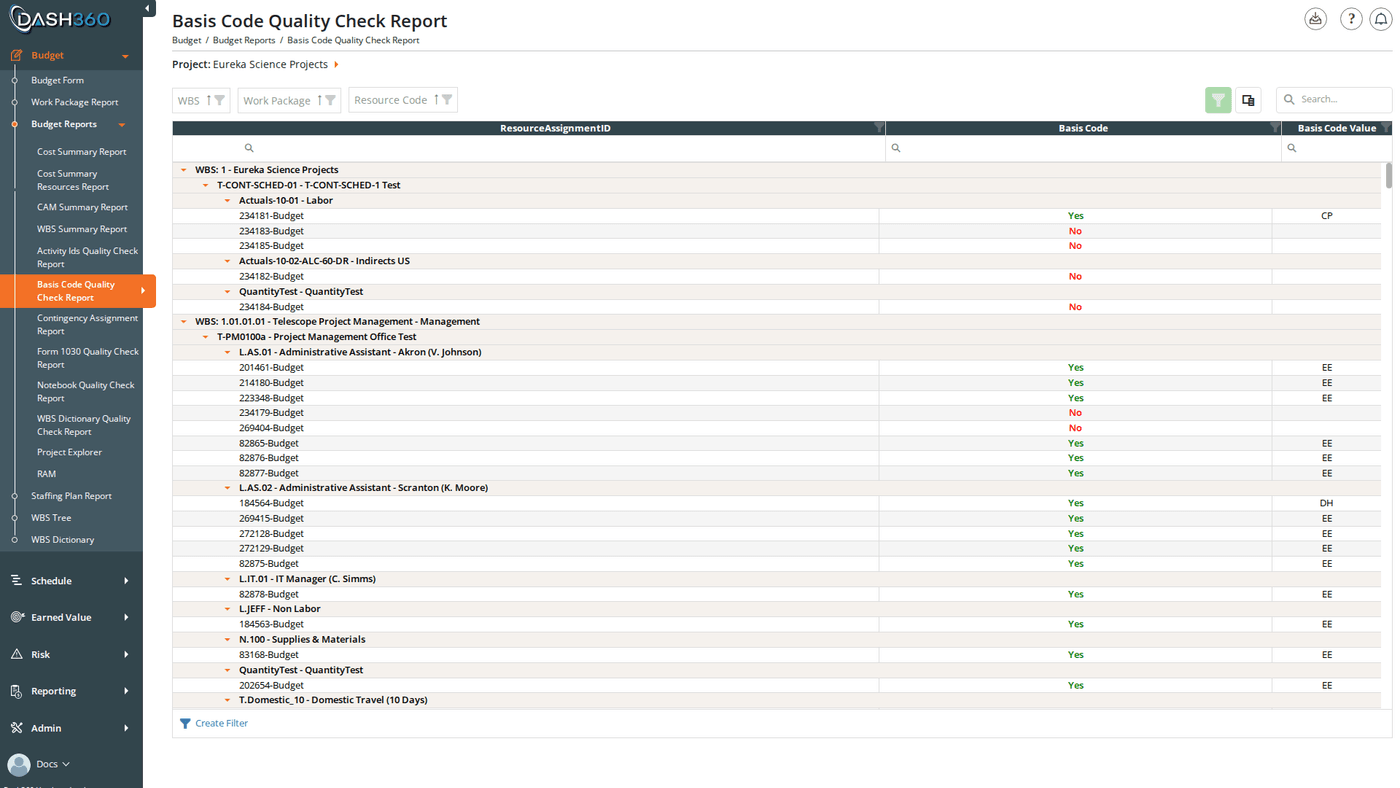
Filters
Columns
Contingency Assignment Report
Shows all contingency assignments in the project. Use this to audit contingency coverage and identify work packages or resource assignments where contingency has not been assigned.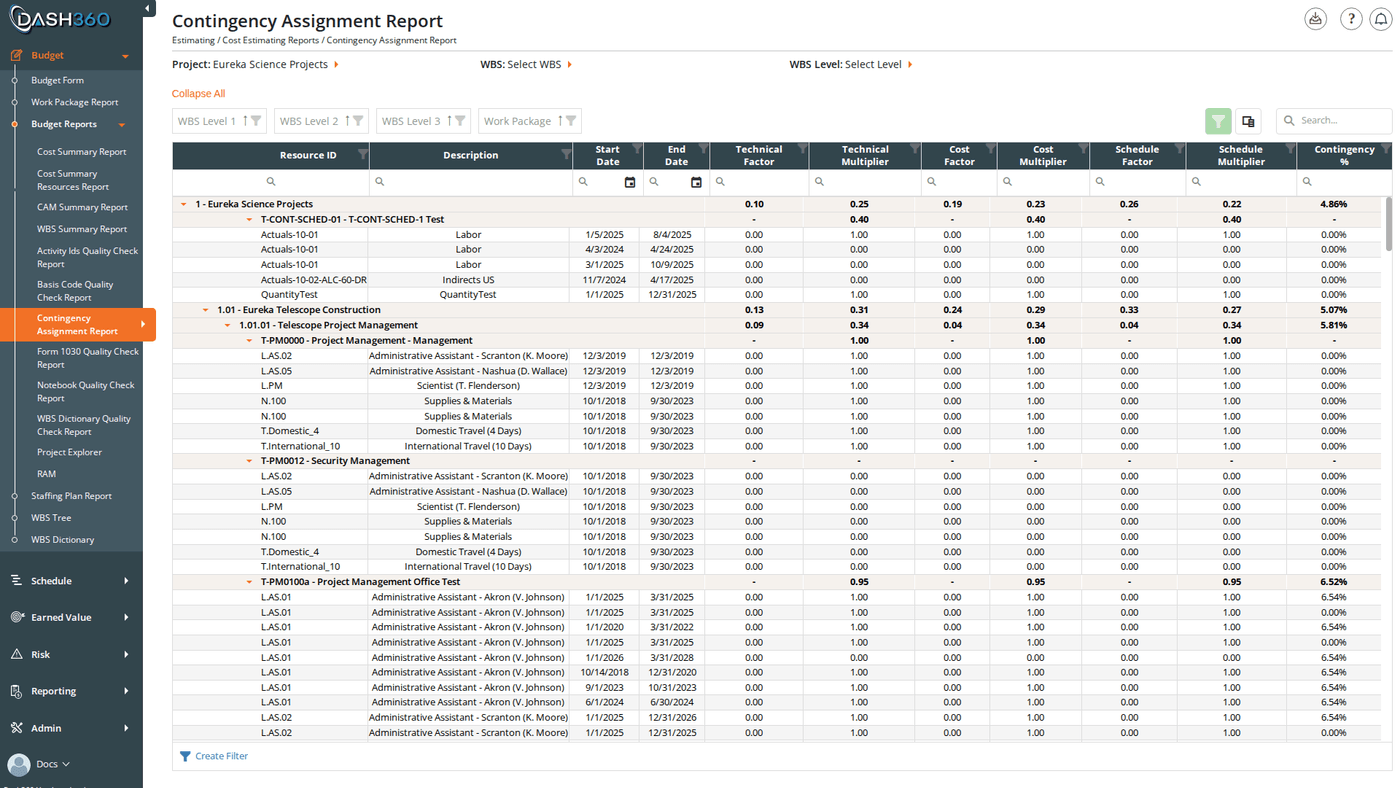
The level at which contingency appears (resource assignment or work package) depends on how the project’s Contingency Mode is configured in the Registry. Some projects track contingency at the RA level; others at the work package level. See Contingency Methodology for details.
Filters
Form 1030 Quality Check Report
Validates that every resource code in the project is mapped to a Form 1030 resource result category. For each resource code, the report shows whether a mapping exists and what category it maps to. Use this report before generating a Form 1030 report to confirm that all codes are properly configured.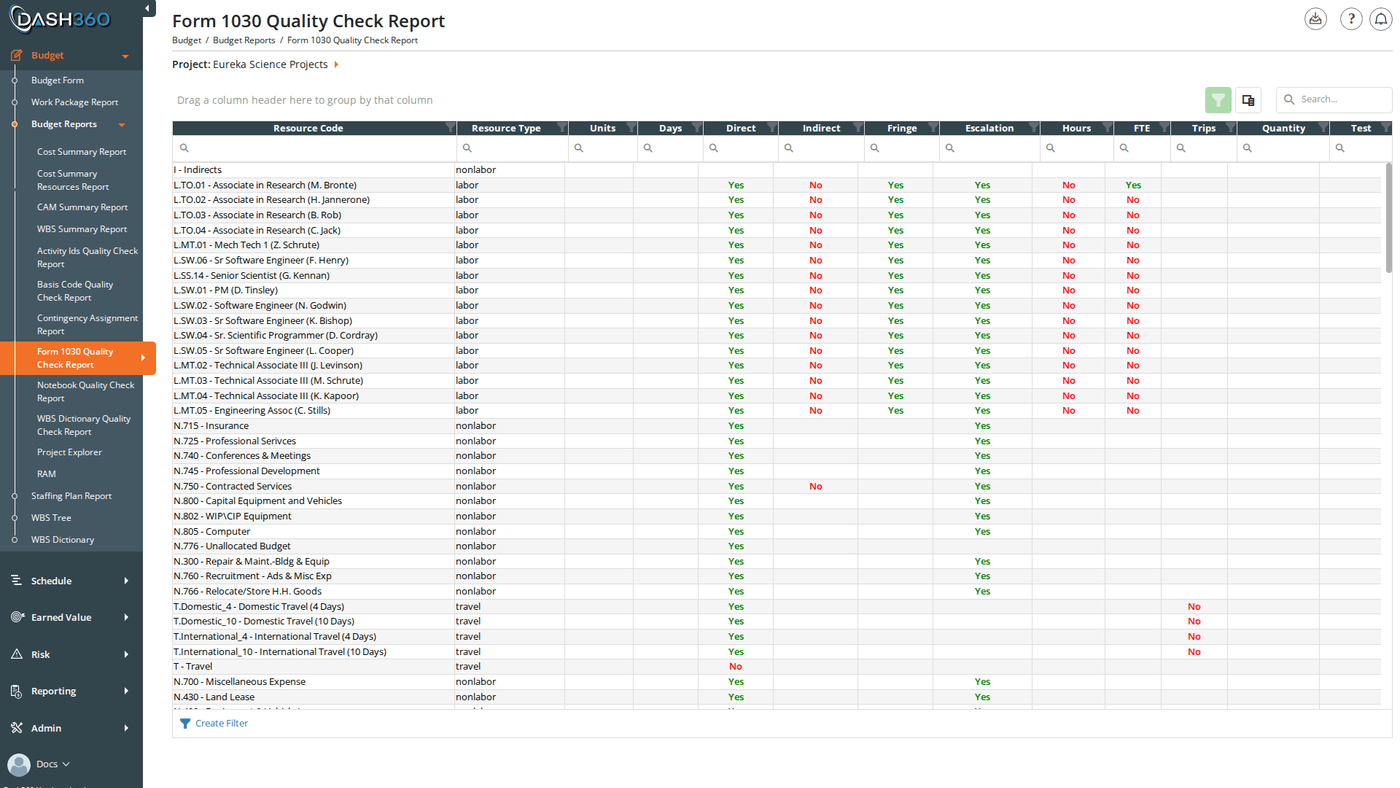
This report requires the project’s resource file to have a Form 1030 file assigned. If no Form 1030 file is configured, the report will not return results.
Filters
Notebook Quality Check Report
Lists all work packages in the project and shows whether each configured notebook field is populated. Each notebook category configured for the project gets its own column. Use this report to find work packages with missing or incomplete notebook entries before a review or deliverable.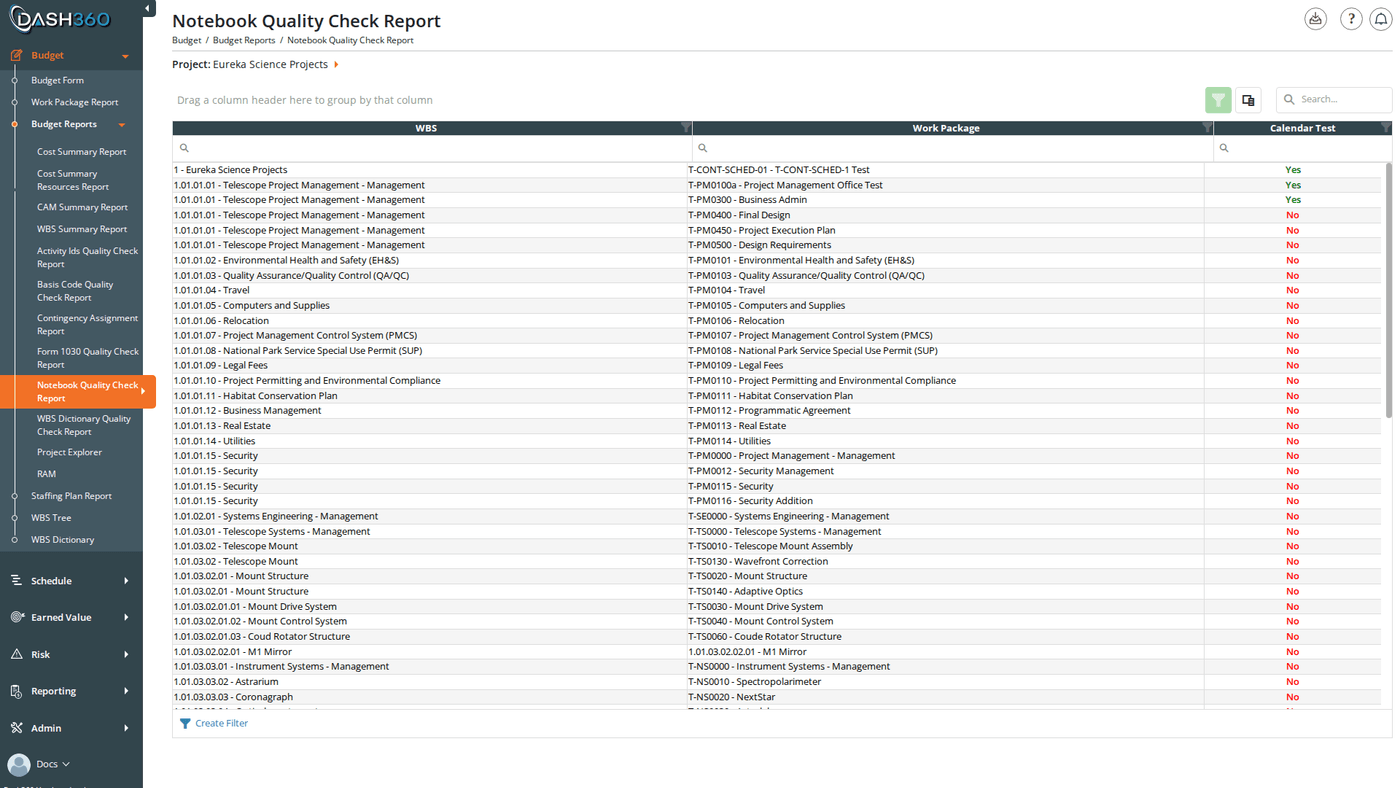
Filters
Columns
WBS Dictionary Quality Check Report
Similar to the Notebook Quality Check Report but for WBS-level notebook entries (the WBS Dictionary). Lists all WBS codes and shows whether each notebook category is populated at the WBS level rather than the work package level.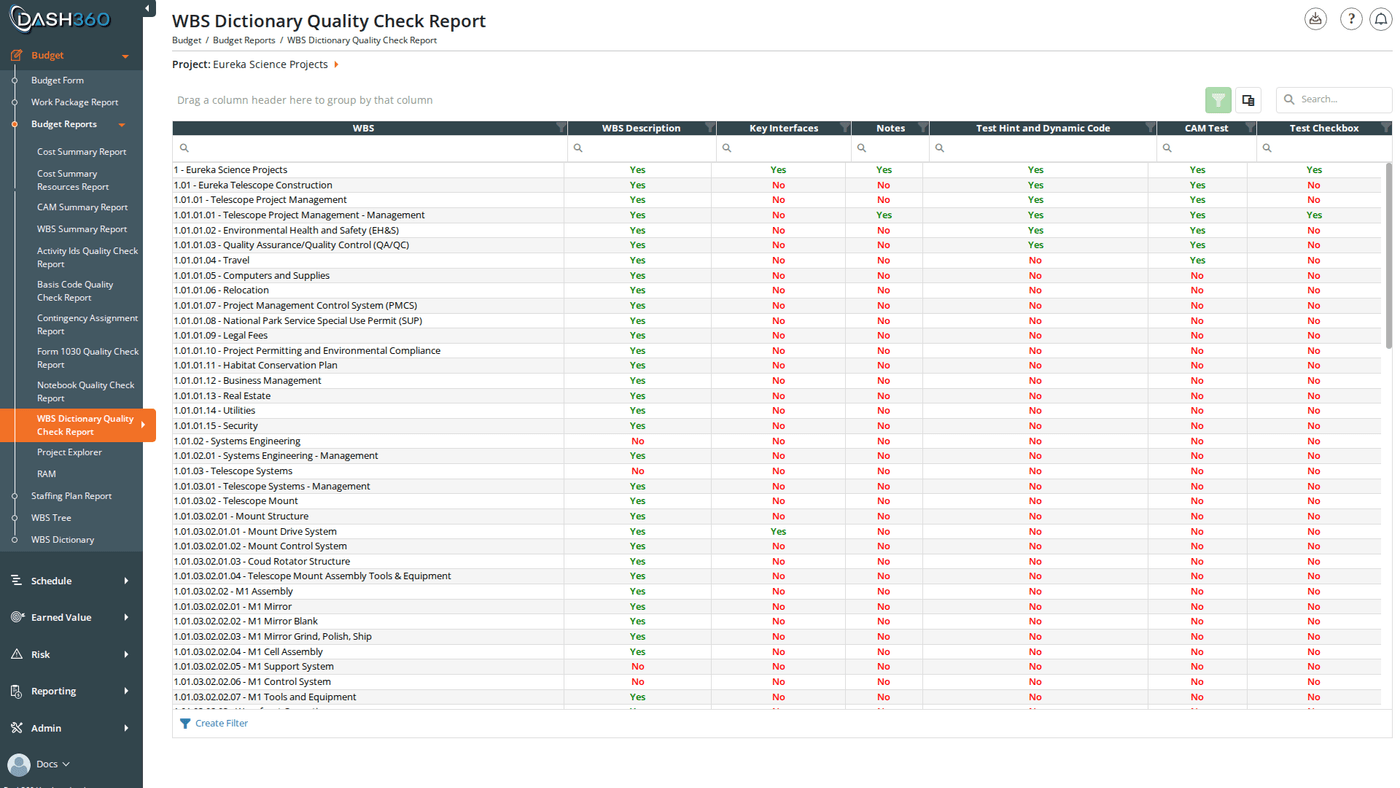
Filters
Columns
Project Explorer
A time-phased cost grid showing estimated costs by WBS and work package. Select a project, optionally filter to a WBS branch or work package, then choose Yearly or Monthly to view costs broken out by fiscal year or calendar month. Use the Project Explorer to drill into the estimate at any level of the hierarchy and compare time-phased spend across the project.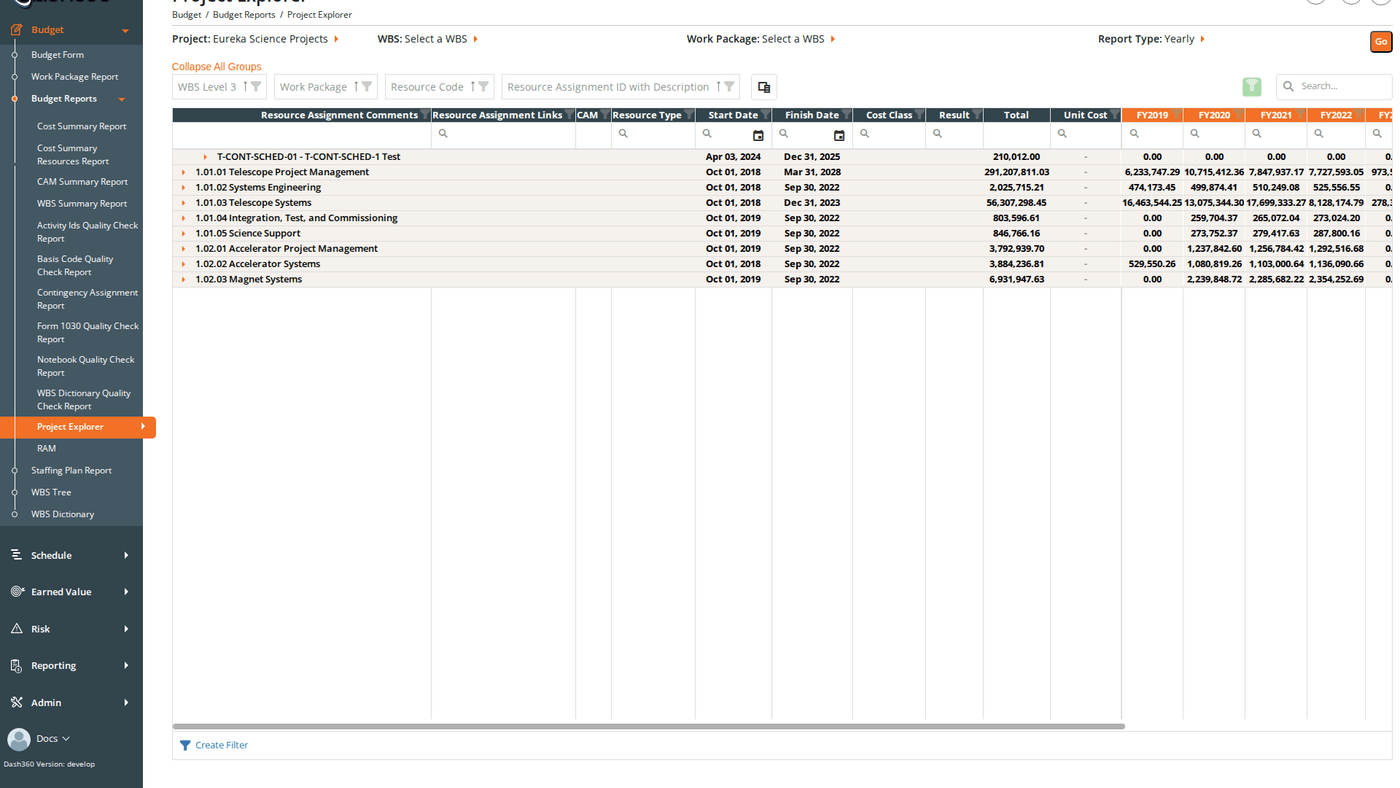
Filters
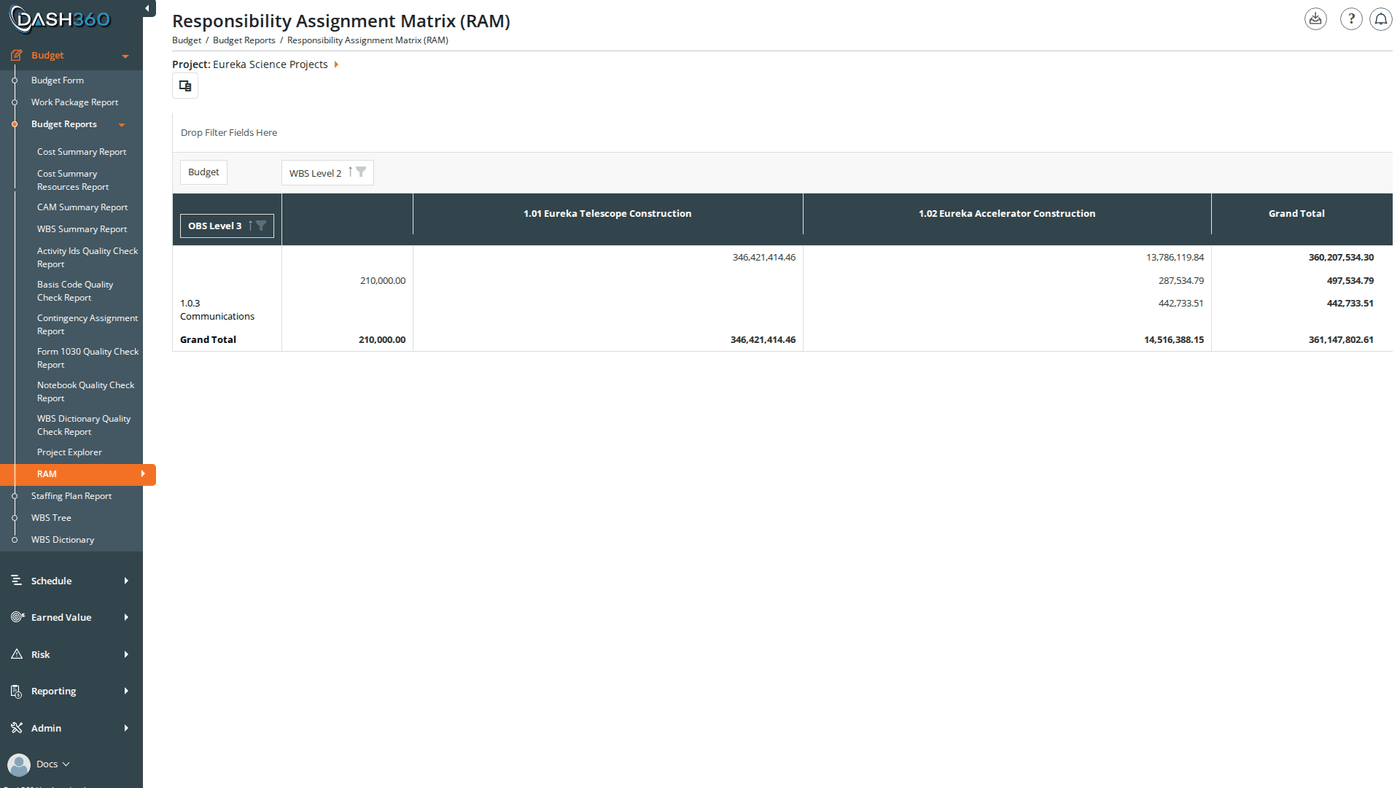
Responsibility Assignment Matrix (RAM)
An interactive pivot grid cross-referencing WBS levels, cost classes, and resource assignments. Use the RAM to pivot the estimate by any combination of dimensions (drag fields into rows, columns, or filters) and inspect rolled-up costs at any intersection. Supports export to Excel.