Overview
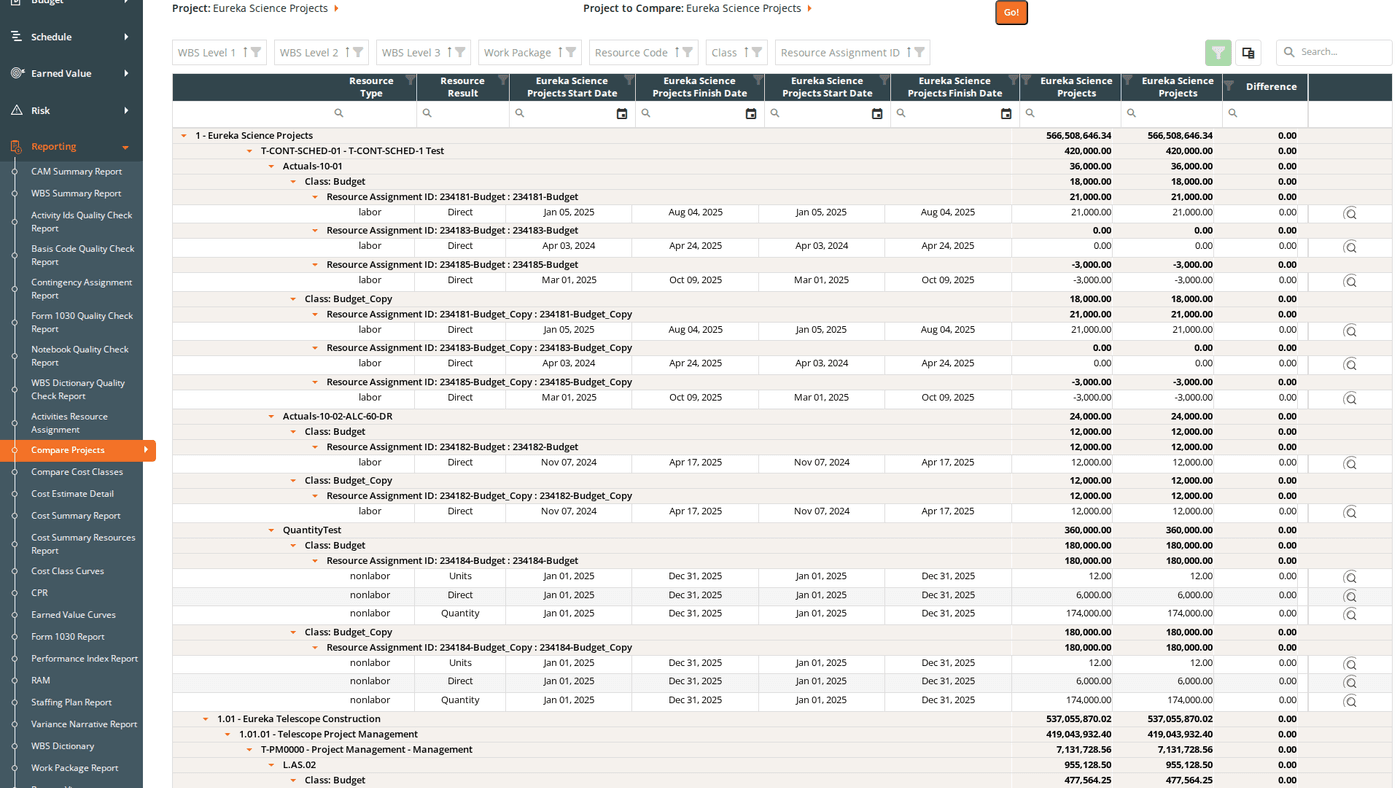
The Compare Projects report matches resource assignments between two projects and displays their costs side by side. Each row shows the cost from Project 1, the cost from Project 2, and the calculated difference, grouped hierarchically by WBS and work package down to the individual resource assignment level.
Use this report to benchmark a new project estimate against a completed project, compare a baseline against a revised estimate, or analyze cost differences across related projects.
URL: /Reporting/CompareProjects/Index
Prerequisites
- Select two projects using the project filter dropdowns. The grid does not load until both are selected.
Filters
| Filter | What It Controls |
|---|
| Project 1 | The first project to include in the comparison |
| Project 2 | The second project to compare against (can be the same project) |
| Currency Divisor | Display values in base dollars, thousands (K), or millions (M) |
Reading the Grid
Hierarchy
The grid is organized hierarchically:
WBS Level 1
└── WBS Level 2
└── WBS Level 3 (and deeper levels if configured)
└── Work Package
└── Resource Code
└── Cost Class
└── Resource Assignment
The grid loads collapsed by default. Expand rows by clicking them, or use the Expand All Groups / Collapse All Groups link above the grid.
Each group row shows summed totals for all three cost columns, so you can compare costs at any level of the hierarchy without expanding to the detail.
Columns
Fixed identifier columns (left side):
| Column | Description |
|---|
| WBS Level 1–3 | WBS group columns, visible by default. Each level also has hidden Number-only and Description-only sub-columns available via the column chooser. |
| WBS Level 4–9 | Hidden by default; add via the column chooser |
| Work Package | Work package group column |
| Resource Code | Resource code group column |
| Class | Cost class group column. Default filter: Budget: only Budget cost class data appears on initial load. Clear or change this filter to see other cost classes. |
| Resource Assignment ID | Resource assignment group column |
| Resource Code Description | Hidden by default; add via the column chooser |
| Resource Assignment Description | Hidden by default; add via the column chooser |
| Resource Type | The type classification for this resource |
| Resource Result | The result type (e.g., Labor Hours, FTEs, Travel) |
| [Project 1] Start Date | Start date for the Project 1 resource assignment. Column header shows the actual project name. |
| [Project 1] Finish Date | Finish date for the Project 1 resource assignment |
| [Project 2] Start Date | Start date for the Project 2 resource assignment |
| [Project 2] Finish Date | Finish date for the Project 2 resource assignment |
Cost comparison columns (right side):
| Column | Description |
|---|
| [Project 1 Name] | Cost from Project 1. Column header shows the actual project name plus the divisor label (e.g., ($K)). |
| [Project 2 Name] | Cost from Project 2. Column header shows the actual project name. |
| Difference | Project 2 minus Project 1. A negative value means Project 2 is lower than Project 1. |
| View | Opens the time-phased RA Detail pivot grid for this row (see below) |
The Class column has a default filter of Budget. If you need to compare other cost classes (Revised, Actuals, etc.), clear or change the Class filter in the filter row.
Time-Phased RA Detail
Click the View button on any resource assignment row to open the RA Detail pivot grid. This shows the cost comparison broken down by period.
Modal header:
Resource Assignment ID: [ID from Project 1]
Compared to Resource Assignment ID: [ID from Project 2]
Pivot structure:
- Rows: Resource Assignment ID and Resource Result type (tree layout; expand a Resource Assignment ID to see its result types)
- Columns: Fiscal Year → Quarter → Month (hierarchical; expand a year to see quarters, expand a quarter to see months)
- Values: Cost for each period
- Subtotals and grand totals: Shown for both rows and columns
Use this view to pinpoint exactly when in the project timeline costs diverge between the two projects.
When to Use This Report
Use Compare Projects when you need to:
- Benchmark estimates: compare a new project’s budget against a completed project of similar scope to validate reasonableness.
- Baseline vs. current: compare an original baseline snapshot (stored as a separate project) against the current working estimate.
- Cross-project analysis: identify which work packages or resource codes account for cost differences between two related projects.
- Find timing of divergence: use the View button to drill into the monthly breakdown and find when the two projects’ costs first diverge.
Saved Views
Compare Projects supports named saved views that preserve your column layout, grouping, and filter settings. Use the view selector in the toolbar to save and reload your own named views.
When viewing a system view, the message “Currently viewing a system view. Changes will not be saved.” appears at the top right of the grid.
Grid Features
| Feature | Description |
|---|
| Expand/Collapse All Groups | Link above the grid. Toggles all group rows at once. |
| Column chooser | Add hidden columns: WBS Level 4–9, WBS Number/Description sub-columns, Resource Code Description, Resource Assignment Description |
| Search panel | Free-text search across all visible columns |
| Filter row | Per-column filter inputs; click Apply Filters to apply |
| Header filter | Click any column header for value-based filtering |
| Filter panel | Shows active filter criteria and allows clearing them |
| Group panel | Drag columns to add additional grouping levels |
| Context menu | Right-click a group row to expand or collapse it individually |
Exporting
Click the Download icon and select Export as Excel. The file is saved as CompareProjects.xlsx with the grid data on a sheet named Compare Projects.