
Overview
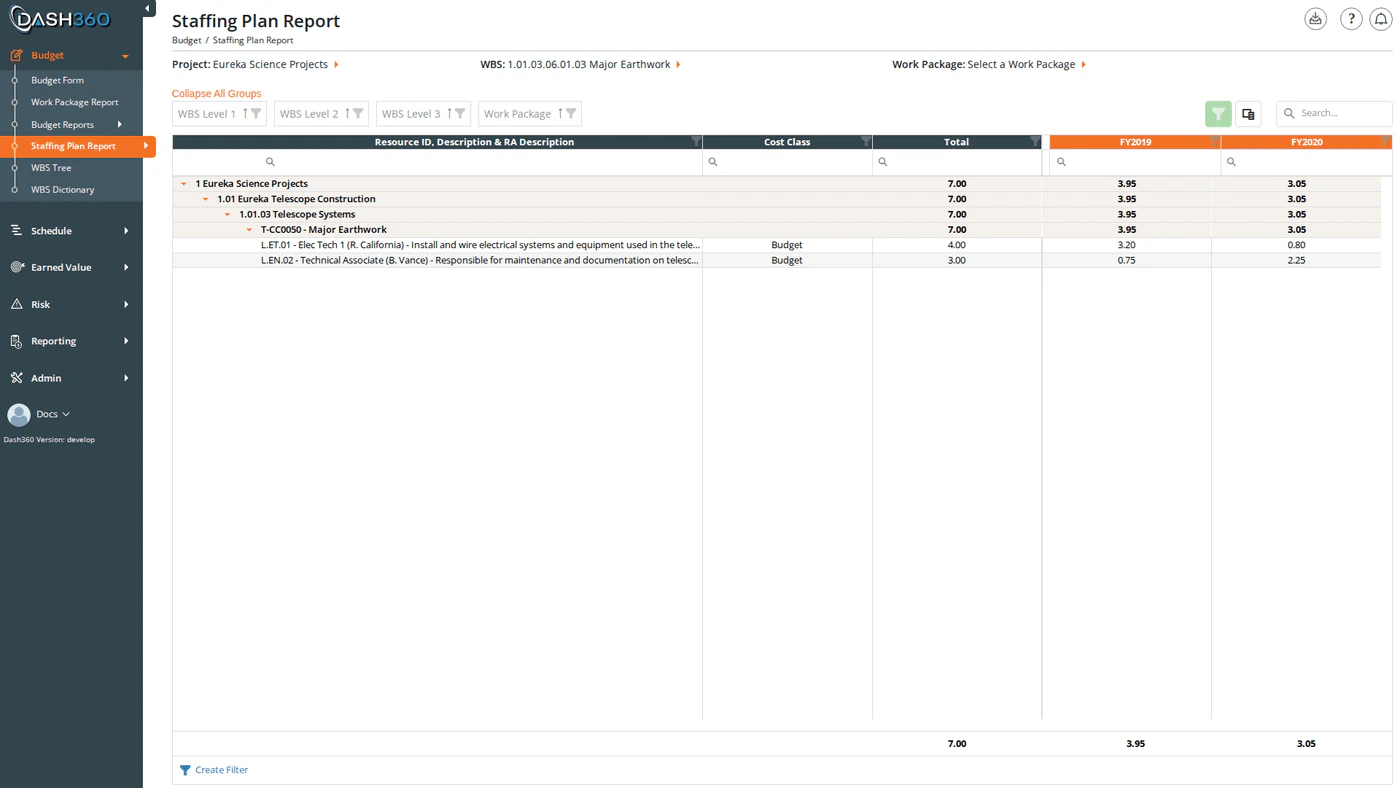
The Staffing Plan Report converts your resource assignments into a clear picture of workforce needs over time. Select a unit (FTEs, hours, or direct costs) and Dash360 displays your resource requirements year by year or month by month, grouped by resource code or broken out to individual assignment level. Use this report to communicate staffing requirements to stakeholders, identify periods of peak demand, and plan hiring or contracting activities. URL:/Estimating/StaffingPlanReport/Index
Prerequisites
- A project must be selected before the report loads.
Filters
| Filter | Description |
|---|---|
| Project | Required. Loads the WBS structure and resource data for the selected project. |
| WBS | Limit the report to a specific WBS element. Selecting a WBS automatically filters the Work Package dropdown to show only work packages within that branch. |
| Work Package | Further limit to a single work package. Populated based on the selected WBS. |
| Unit | Controls what value is shown in the time-phased cells: FTE, Hours, or Direct Cost. |
| Scale | Sets the time granularity: Yearly (one column per fiscal year) or Monthly (one column per month). |
| Report Type | Controls the level of detail in rows. See Report Type below. |
| Cost Class | Which cost class to use (Budget, Actual, Forecast, or a configured cost set). Defaults to Budget. |
| Calendar | Appears only when the project uses custom fiscal calendars. Selecting a calendar replaces the Scale filter; the time-phased columns reflect that calendar’s configured periods instead of standard fiscal years or months. |
Display Units
| Unit | Description |
|---|---|
| FTE | Full-Time Equivalents: workforce need expressed as fractional headcount |
| Hours | Total hours required per period |
| Direct Cost | Resource costs in currency (uses the configured rate file) |
Time Scale
Switch between time increments using the Scale selector:| Scale | Description |
|---|---|
| Yearly | One column per fiscal year: best for long-range planning |
| Monthly | One column per month: most granular view |
Report Type
The Report Type filter controls how resource rows are structured in the grid.| Mode | Description |
|---|---|
| Resource Code | Each resource code appears as its own row, rolled up across all work packages that use it. This is the default view; it answers “how many FTEs of Resource X does this project need?” |
| Resource Assignment | Each individual resource assignment is its own row, identified by a Resource Assignment ID. Use this mode to see costs or hours at the individual assignment level rather than rolled up by resource. |
Columns
The grid organizes data as a hierarchy of grouped rows followed by a fixed Total column and dynamic time-phased columns.Row Grouping
The grid groups rows by WBS level and work package. The first three WBS levels are visible by default; deeper WBS levels are hidden and can be added via the column chooser.| Column | Description | Default |
|---|---|---|
| WBS Level 1 | Top level of the WBS hierarchy | Visible (grouped) |
| WBS Level 2 | Second WBS level | Visible (grouped) |
| WBS Level 3 | Third WBS level | Visible (grouped) |
| WBS Level 4–9 | Deeper WBS levels | Hidden |
| Work Package | Work package name | Visible (grouped) |
| Resource | Resource code with description. In Resource Assignment mode, includes the RA description as well. | Visible |
| Resource Assignment ID | The resource assignment identifier | Visible in Resource Assignment mode only |
| Cost Class | The cost class for this row | Visible |
Additional Columns (hidden by default)
Add these via the column chooser:| Column | Description |
|---|---|
| CAM | Control Account Manager assigned to the work package |
| Resource Level 1–N | Individual levels of the resource hierarchy (if configured) |
| [Notebook Category] | One column per configured work package notebook category |
| [Linked Code File Fields] | One column per linked code file field configured for the project |
| [RA Notebook Fields] | Resource assignment notebook fields |
Time-Phased Columns
One column per fiscal year (Yearly mode) or per month (Monthly mode), labeled with the period identifier. In custom calendar mode, columns reflect the calendar’s configured periods. The column for the current reporting period is highlighted: the header appears in orange and the data cells in a light orange shade, making it easy to locate where the project stands today.Total Column
A Total column (fixed on the left side of the time-phased columns) shows the sum across all periods for each row. Group rows display a subtotal for each time-phased column, summing all rows within the group.Expanding and Collapsing Groups
Click the Expand All Groups / Collapse All Groups link above the grid to toggle all groups at once. The link label updates to reflect the current state. You can also right-click any group row header for per-group expand and collapse options.Grid Features
| Feature | Description |
|---|---|
| Search panel | Free-text search across all visible columns |
| Filter row | Per-column filter inputs; click Apply Filters to apply |
| Header filters | Click any column header to filter by specific values |
| Filter panel | Shows active filter criteria and allows clearing them |
| Column chooser | Add or remove columns, including hidden WBS levels, CAM, resource hierarchy, and notebook fields |
| Column reordering | Drag column headers to reorder |
| Column fixing | Right-click a column header to pin it to the left |
| Group panel | Drag columns to the group panel to add additional grouping levels |
| Context menu | Right-click a group row to expand or collapse that group individually |
Section Views
Section Views save the full grid state along with the Scale, Unit, and Report Type filter selections. When you load a Section View, both the column layout and the filter settings are restored together.- User views are saved per-user and visible only to you.
- System views are created by administrators and available to all users.
Exporting
Click Export to download the staffing plan asStaffingPlanReport.xlsx. The export preserves the current grouping structure, column layout, and all visible data exactly as shown in the grid.

