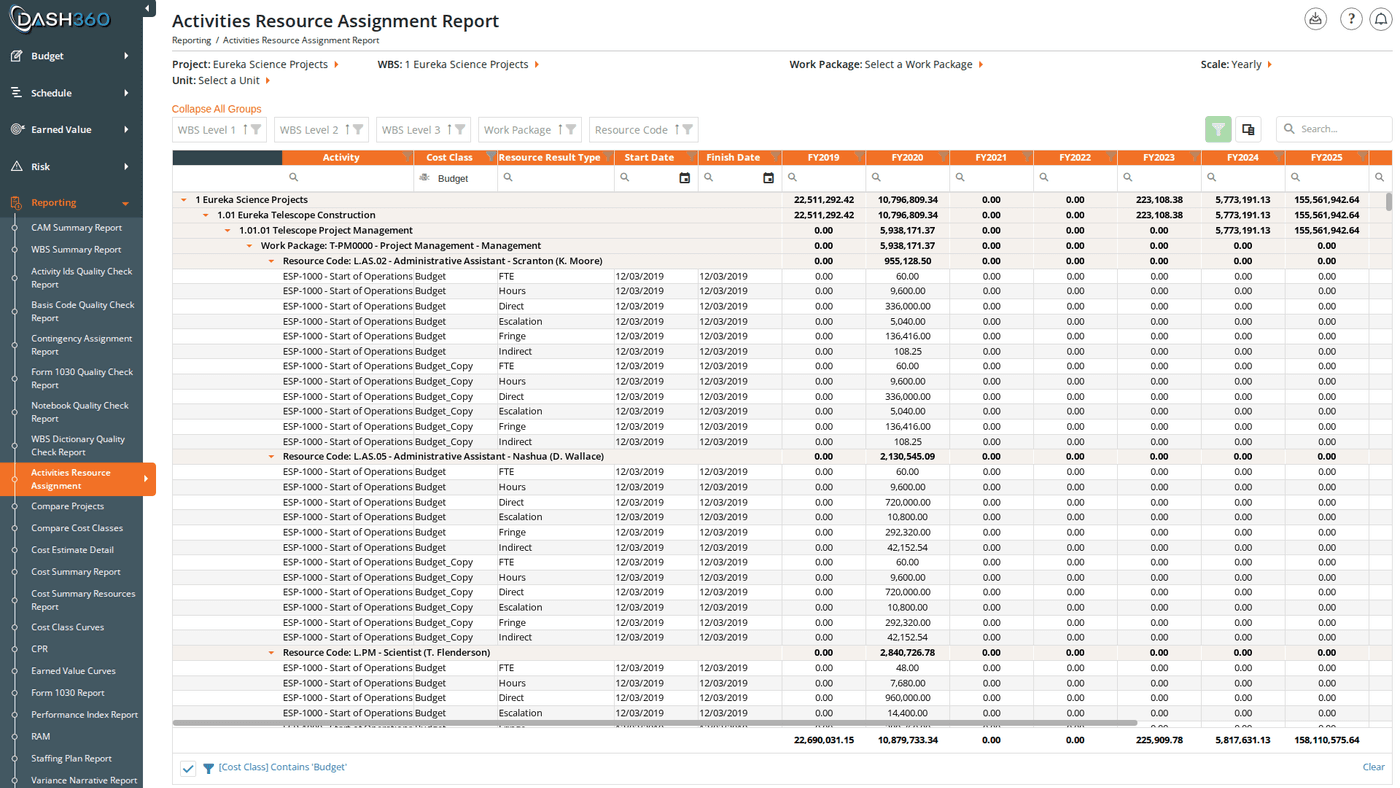
Overview
The Activities by Resource report bridges your schedule and your budget. It shows exactly which resources are assigned to which schedule activities, with cost data time-phased across the project timeline. This makes it easy to verify that every activity has resource coverage, identify misalignments between your schedule and your budget, and analyze how costs are distributed across the project timeline. URL:/Reporting/ActivitiesByResourceReport/Index
Prerequisites
- Select a project. The report does not load until a project is selected.
Filters
The page header contains five inline filters. Selecting a project immediately loads the grid. Selecting a WBS reloads the grid and populates the Work Package dropdown. Selecting a Work Package reloads the grid scoped to that one work package.Custom Calendar Projects
For projects configured with a custom calendar, the Scale dropdown is replaced by a Calendar dropdown listing the project’s named calendars. Selecting a different calendar reloads the time-phased columns using that calendar’s period labels instead of fiscal year or month names.View Modes
The report offers two modes, controlled by a Report Type selector:
Switch between modes based on whether you need individual resource type detail or a higher-level cost summary.
Reading the Grid
Hierarchy
The grid is organized hierarchically with group rows at each level:Fixed Columns
These columns appear at the left side of the grid and remain visible while scrolling through time-phased columns:The Cost Class column has a default filter of Budget. If you need to see other cost classes (Revised, Actuals, etc.), clear or change the Cost Class filter in the filter row.
Time-Phased Columns
After the fixed columns, one column appears per fiscal year or calendar month (depending on the Scale setting), followed by a Total column. For custom calendar projects, columns use the calendar’s period labels. Column header styling:- Time-phased column headers have an orange background to visually distinguish them from the fixed identifier columns.
- The cell in a data row whose column matches the current reporting period is highlighted in light orange; making the active period easy to locate when scrolling across many columns.
When to Use This Report
Use Activities by Resource when you need to:- Verify coverage: Confirm that every schedule activity has at least one resource assignment.
- Spot misalignments: Find activities where the resource assignment dates don’t match the scheduled activity dates.
- Analyze cost distribution: Understand how costs spread across the project timeline at the activity level rather than the work package level.
- Connect schedule and budget: Use alongside the Schedule Viewer to cross-reference activity timing against resource costs.
Saved Views
Activities by Resource supports named saved views that preserve your column layout, grouping, and filter settings. Use the view selector in the toolbar to save and reload your own named views.When viewing a system view, the message “Currently viewing a system view. Changes will not be saved.” appears at the top right of the grid.
Grid Features
Exporting
Click the Download icon and select Export as Excel. The file is saved asActivitiesByResourceReport.xlsx with the grid data on a sheet named ActivityByRA.