

Overview
Dash360 Risk has three related but distinct features that people often blur together. Two of them are correlation (they link uncertainty so items move together), and one is mapping (it routes a risk’s schedule impact to activities). Keeping them separate is the key to reading your Monte Carlo results correctly.Correlation links like to like: a risk to another risk, or an activity to another activity. There is no risk-to-activity correlation in Dash360. The only thing that links a risk to an activity is Activity Mapping, and that is routing, not correlation.
What “correlation” means in Dash360
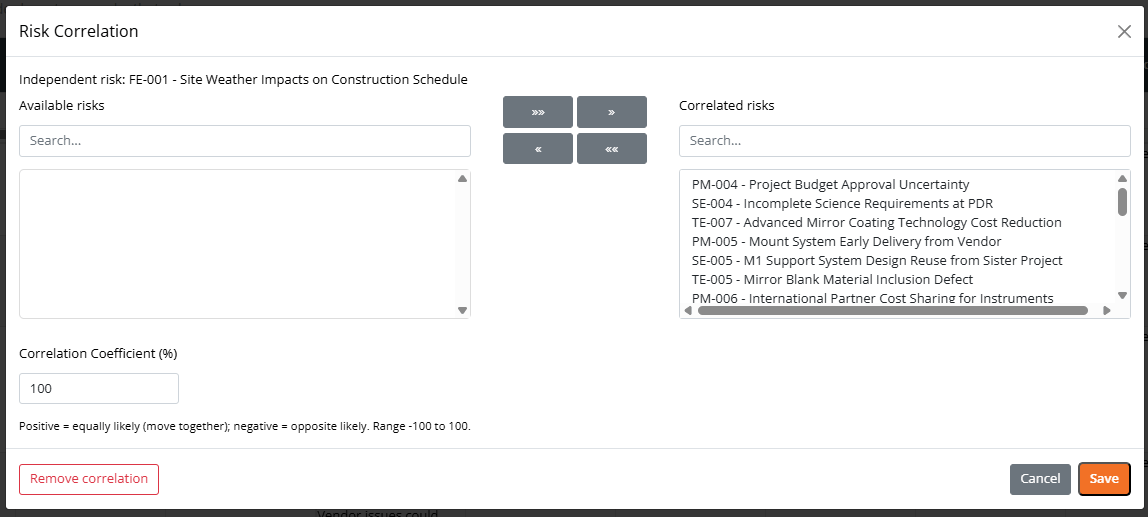
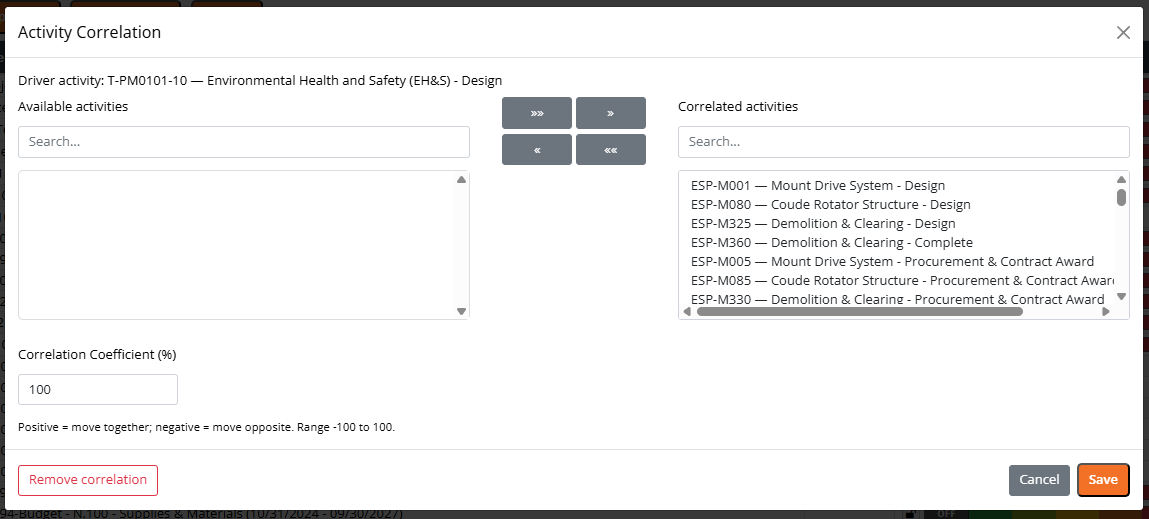
By default, every activity and every risk is sampled independently in each Monte Carlo iteration. Independent draws tend to cancel out: in a given iteration one item lands high while another lands low, so the totals average toward the middle. That understates the real spread of the total, because in the real world related items often move in the same direction at the same time. Correlation is how you tell the simulation that certain items move together. When you correlate items, they share their random draw in each iteration, so they tend to land high together or low together. Each correlation group has a single coefficient from -100% to +100%:- +100%: the members take the driver’s draw exactly (they fully move together).
- A positive value below 100%: the members move partly with the driver and partly on their own.
- 0%: independent (no effect).
- A negative value: the members tend to move opposite the driver.
The three mechanisms
1. Activity-to-Risk Mapping (routing)

- Relative (default): distribute the impact across the mapped activities by each activity’s Weight (%).
- Absolute: apply the full impact to each mapped activity.
2. Risk-to-Risk Correlation (Pro)
3. Activity-to-Activity Correlation (Pro)
How they relate
The clearest way to hold all three in your head:- Correlation changes how big and how together impacts are. It is always like-to-like (risk to risk, or activity to activity).
- Mapping changes where a risk’s schedule impact lands (which activities absorb it).
Activity Mapping and Risk-to-Risk correlation are independent. Editing a risk’s mapped activities does not change any correlation between that risk and another risk, and adding or removing a correlation does not change a risk’s activity mapping. Mapping only reroutes where a risk’s (possibly correlated) schedule impact is applied.
Side-by-side comparison
When to use each
- Map a risk to activities whenever the risk has a schedule impact and you know which activities it delays. Without a mapping, the delay is applied to the project finish instead of to a specific activity, and the risk will not appear in the Activity Drivers chart.
- Correlate risks when two or more risks share a common cause and would realistically hit together. Independent risks understate the P80 and P90 you need for contingency.
- Correlate activities when two or more activities share a driver (crew, weather, vendor) and would realistically run long or short together.
Frequently asked questions
Do correlations only apply to Mitigated risks?
Do correlations only apply to Mitigated risks?
No. Correlation is applied to each risk’s random draws before any impact is calculated, so it affects both result views: the Risk graph (pre-mitigation) and the Mitigated Risk graph (post-mitigation). You can also set correlations on risks whether or not they are mitigated.
Is correlating risks the same as mapping a risk to its activities?
Is correlating risks the same as mapping a risk to its activities?
No. These are two separate features. Risk-to-Risk correlation links one risk’s uncertainty to another risk’s uncertainty; it is always risk-to-risk. Activity Mapping links a single risk to the schedule activities its impact should land on; it is routing, not correlation. There is no risk-to-activity correlation in Dash360, so you cannot correlate a risk directly to an activity.
Does changing a risk's Activity Mapping change its correlation?
Does changing a risk's Activity Mapping change its correlation?
No. Mapping and correlation are independent. Changing the mapped activities on a risk only changes where that risk’s schedule impact lands; it does not change any Risk-to-Risk correlation the risk participates in. Likewise, adding or removing a correlation does not change the risk’s mapping.
Can an item be in more than one correlation group, or be both a driver and a follower?
Can an item be in more than one correlation group, or be both a driver and a follower?
Not in this release. Each activity or risk can belong to only one correlation group, and an item cannot be both a driver and a follower at the same time.
Related pages
- Risk Register: the Activity Mapping section and the Risk Correlation column.
- Risk Analysis: the Cost & Schedule Uncertainty tree and Activity Correlation.
- How the Dash360 Monte Carlo Works: the underlying copula math and how correlation enters the simulation.