Building a Flat Data Grid
A Flat Data Grid is a tabular report: rows and columns, with grouping, sorting, filtering, and totals. Use it when people need to see detailed rows or export raw data to Excel.This page is part of the Report Studio guide. For choosing fields and building formulas, see Fields and Calculated Fields.
Build it
1
Create the report
On the landing page, click Create New Report and choose Flat Data Grid.
2
Choose your projects
Select one or more project snapshots. You can combine snapshots from several projects.
3
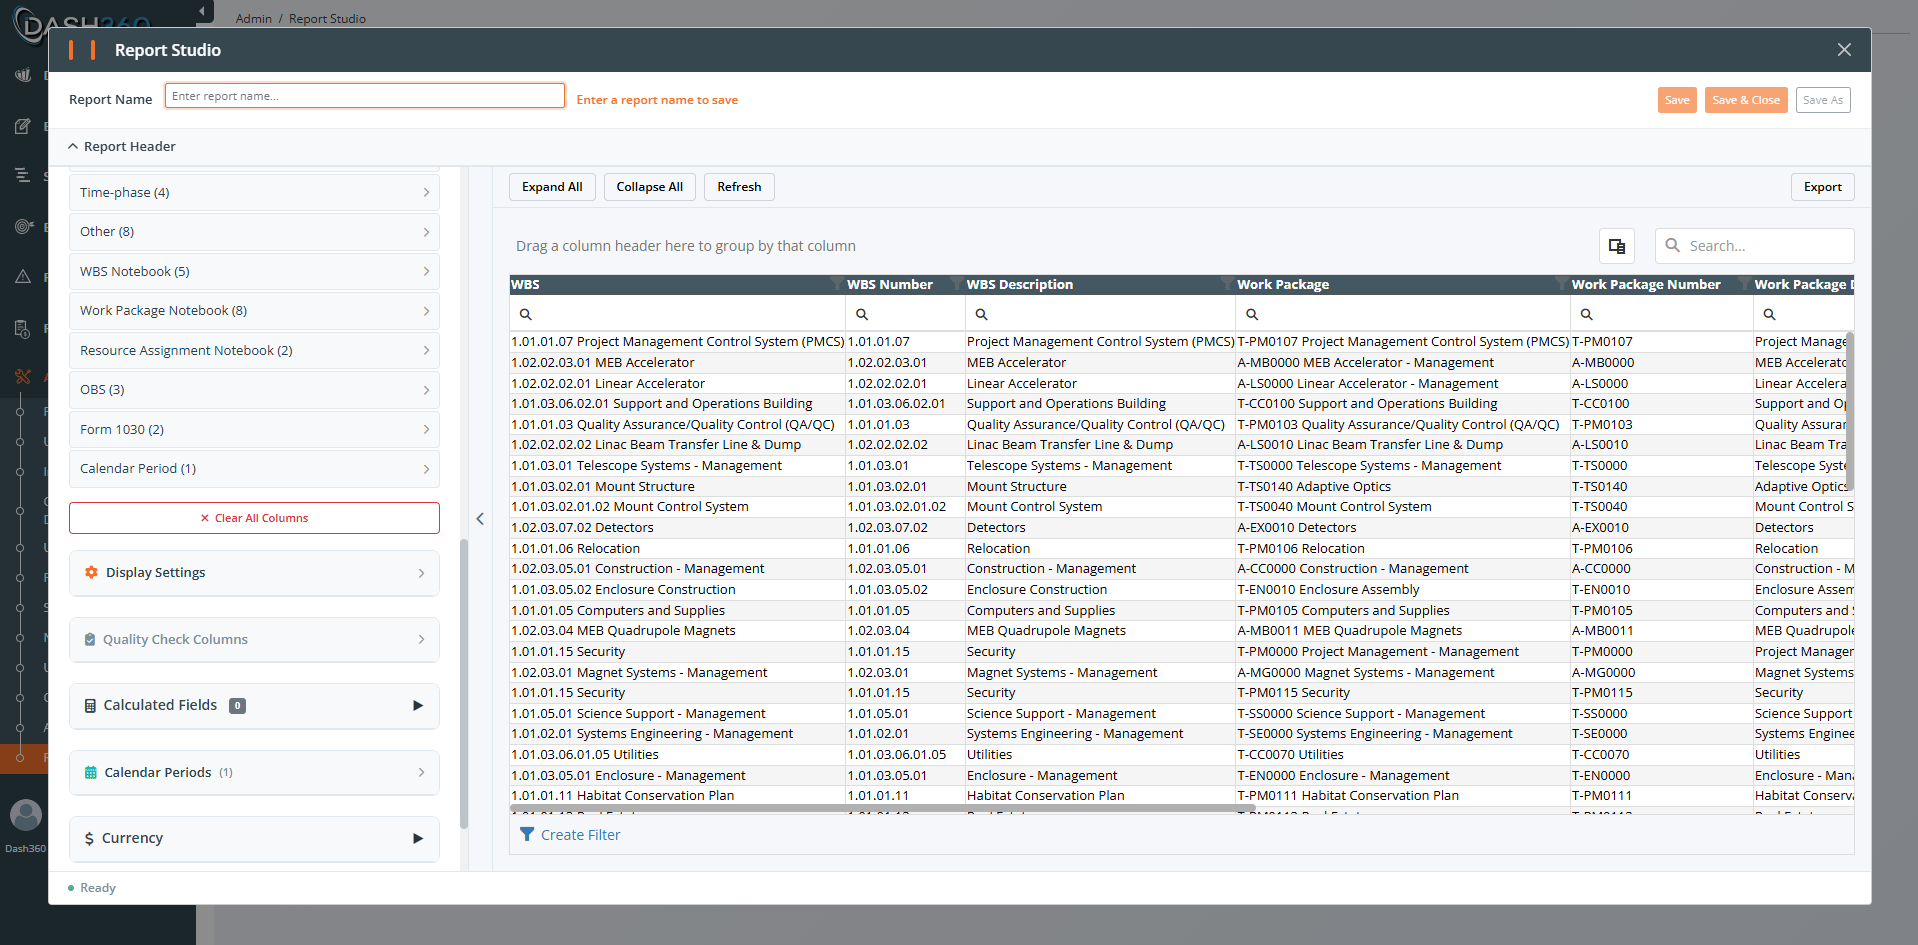
Add columns
Add columns one of two ways:
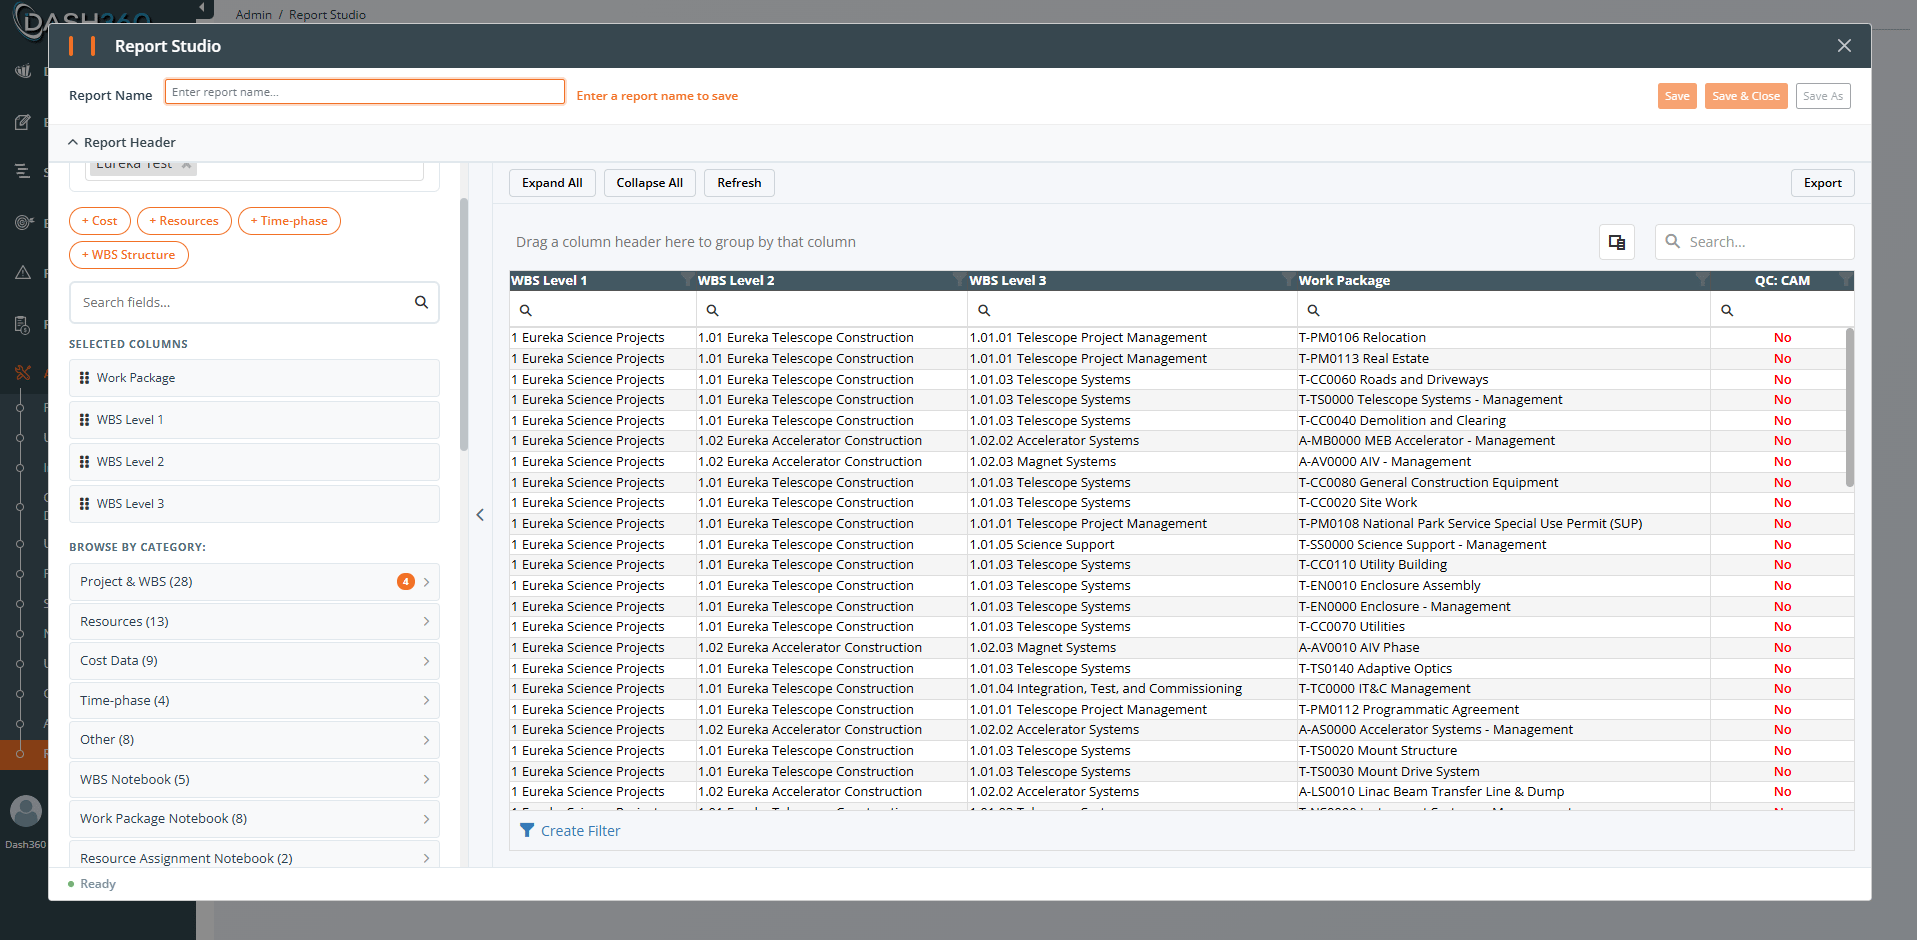
- Quick-Add buttons add a whole category at once: + Cost, + Resources, + Time-phase, + WBS Structure.
- Browse by category and check individual columns.
4
Arrange columns
In the Selected Columns panel, drag columns to reorder them. For each column you can:
- Click the gear icon to Edit caption (change the display name; the data is unchanged).
- Click the undo icon to Reset caption back to the default.
- Click the X icon to Remove column.
5
Set display options
Open Display Settings and set the toggles (see the table below).
6
Add Quality Check columns (optional)
Add Yes/No columns that check whether a field is empty or missing, useful for data-quality audits. See Quality Check columns.
7
Add a header, then save
Add a title, subtitle, and description, then click Save.
Display settings
Fiscal Year prefix
Dash360 detects whether your selected projects use fiscal or calendar years. When all selected projects are the same, the prefix is applied automatically and an information row tells you so. When you mix fiscal-year and calendar-year projects, a Show Fiscal Year Prefix toggle appears so you can decide.Totals and summaries
- The Summary Footer toggle controls the grand-total row at the bottom.
- Column totals appear for numeric cost columns the report displays (for example, Item Cost, Contingency, Unit Cost, Units).
- Calculated fields can also produce totals. See Fields and Calculated Fields.
Quality Check columns
Quality Check columns turn a field into a simple Yes/No answer to “does this row have a value here?”- Open the Quality Check Columns section and pick the fields to check.
- Each one becomes a column captioned
QC: {Field}by default; you can edit the caption. - Use Clear All QC Columns to remove them all at once.
Performance: apply filters early
A Flat Data Grid runs entirely on the server (the server does the paging, sorting, filtering, and totals, then sends back only what the grid needs). The single biggest thing you can do for responsiveness is reduce the number of rows the report has to work with:- Select only the projects you need. Every extra snapshot adds rows.
- Add only the columns you need. Fewer columns means less data per row.
- Group and expand on demand rather than expanding everything at once on a huge dataset.
- Results are cached for up to 30 minutes, so re-running the same report with the same filters is fast. Changing filters or projects runs a fresh query.
Pitfalls to avoid
Where to go next
Building a Pivot Grid
Cross-tab analysis with drag-and-drop zones.
Understanding Your Data
Snapshots, filters, permissions, and caching.