Building a Pivot Grid
A Pivot Grid is a cross-tabular report. You drag fields into zones to summarize cost across two dimensions at once, for example WBS down the side and fiscal year across the top, with cost in the cells. Use it for analysis and roll-ups.This page is part of the Report Studio guide.
Build it
1
Create the report
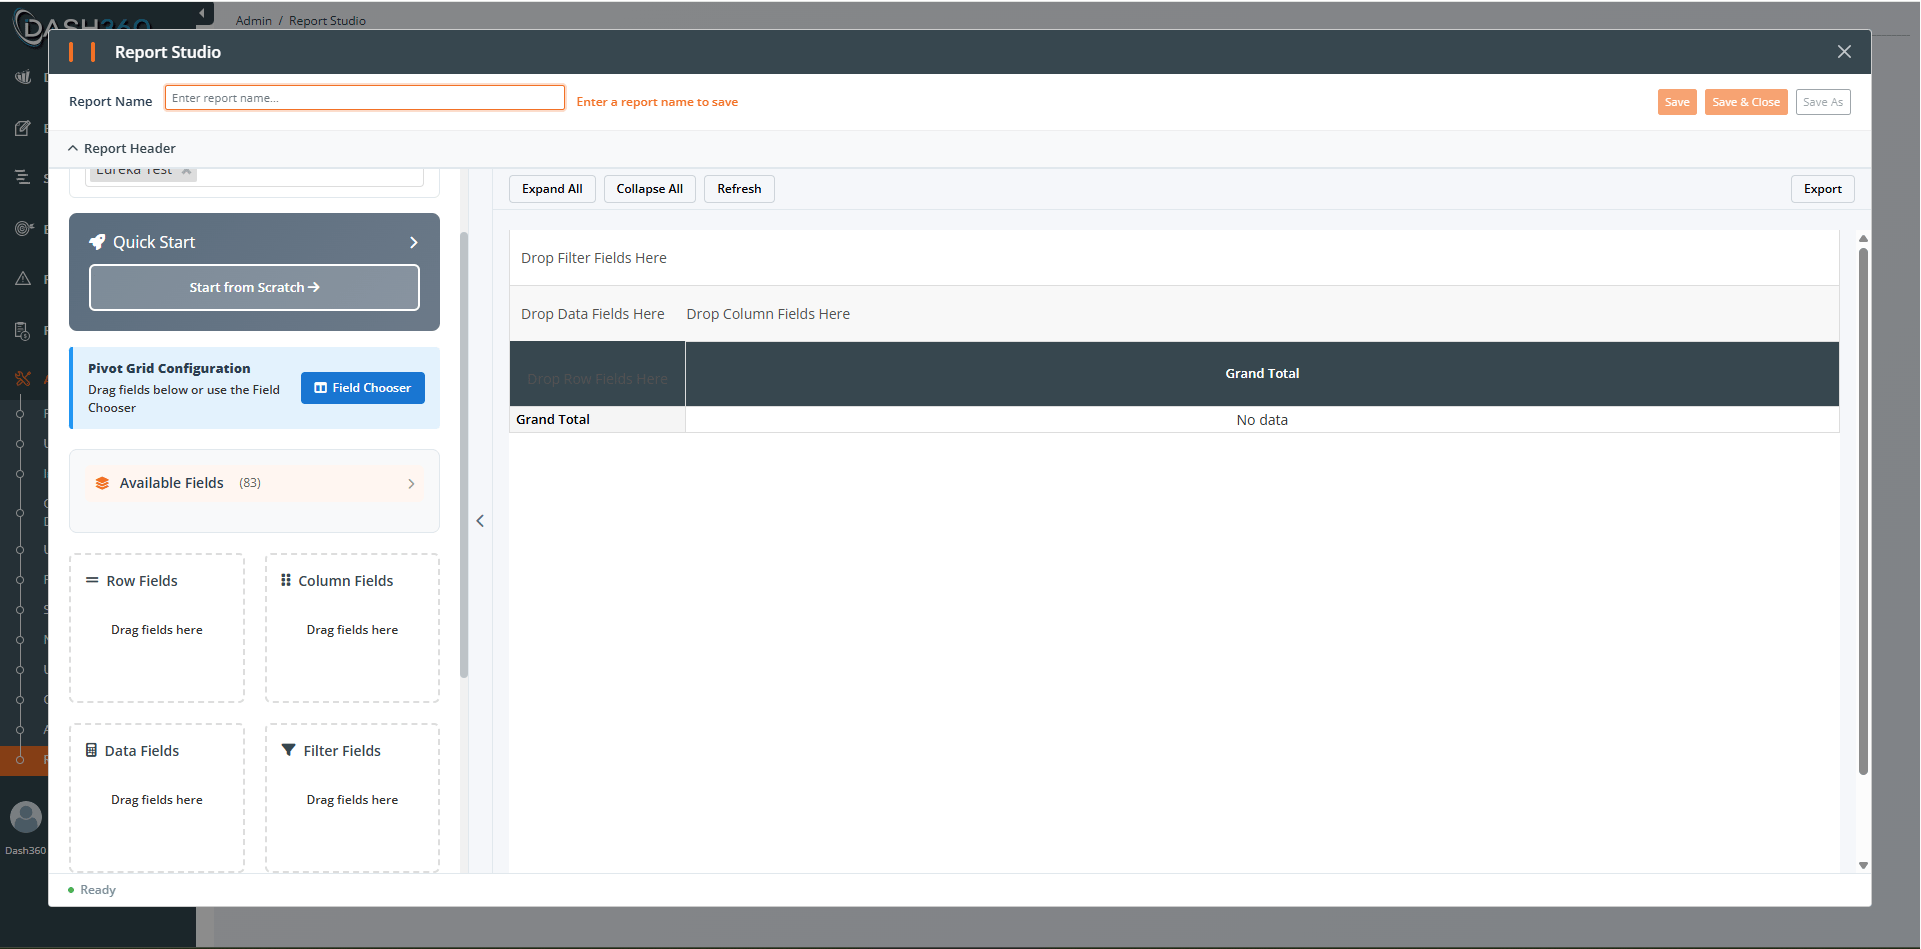
On the landing page, click Create New Report and choose Pivot Grid.
2
Choose your projects
Select one or more project snapshots.
3
Start from a template or scratch
The Quick Start section offers preset templates for common layouts. Pick one to get a head start, or click Start from Scratch.
4
Place fields into zones
Use the Pivot Field Manager to drag fields into four zones (see below). Drag within a zone to reorder, drag to another zone to move, or click the X to remove.
5
Set data field aggregation
Click the summary-type badge on a Data field to choose how it is summarized: sum, avg, count, min, max, diffRow (difference across rows), or diffCol (difference across columns).
6
Configure display settings
Open Display Settings to set layout, totals, captions, and interaction options (see below).
7
Add a header, then save
Add a title, subtitle, and description, then click Save.
The four zones
Display settings
Layout
Totals
Total captions
- Subtotal Label: customize the subtotal label; use
{0}for the group name (placeholder is{0} Total). - Grand Total Row Label: customize the grand-total row label (placeholder is
Grand Total). - Grand Total Column Label: customize the grand-total column header.
Display
- Word Wrap: wrap long header text instead of cutting it off (default off).
- Alternating Rows: zebra striping for readability (default off).
Interaction
Fiscal Year prefix
As with the Data Grid, the fiscal-year prefix is detected automatically when all projects match, and offered as a Show Fiscal Year Prefix toggle when you mix fiscal and calendar projects.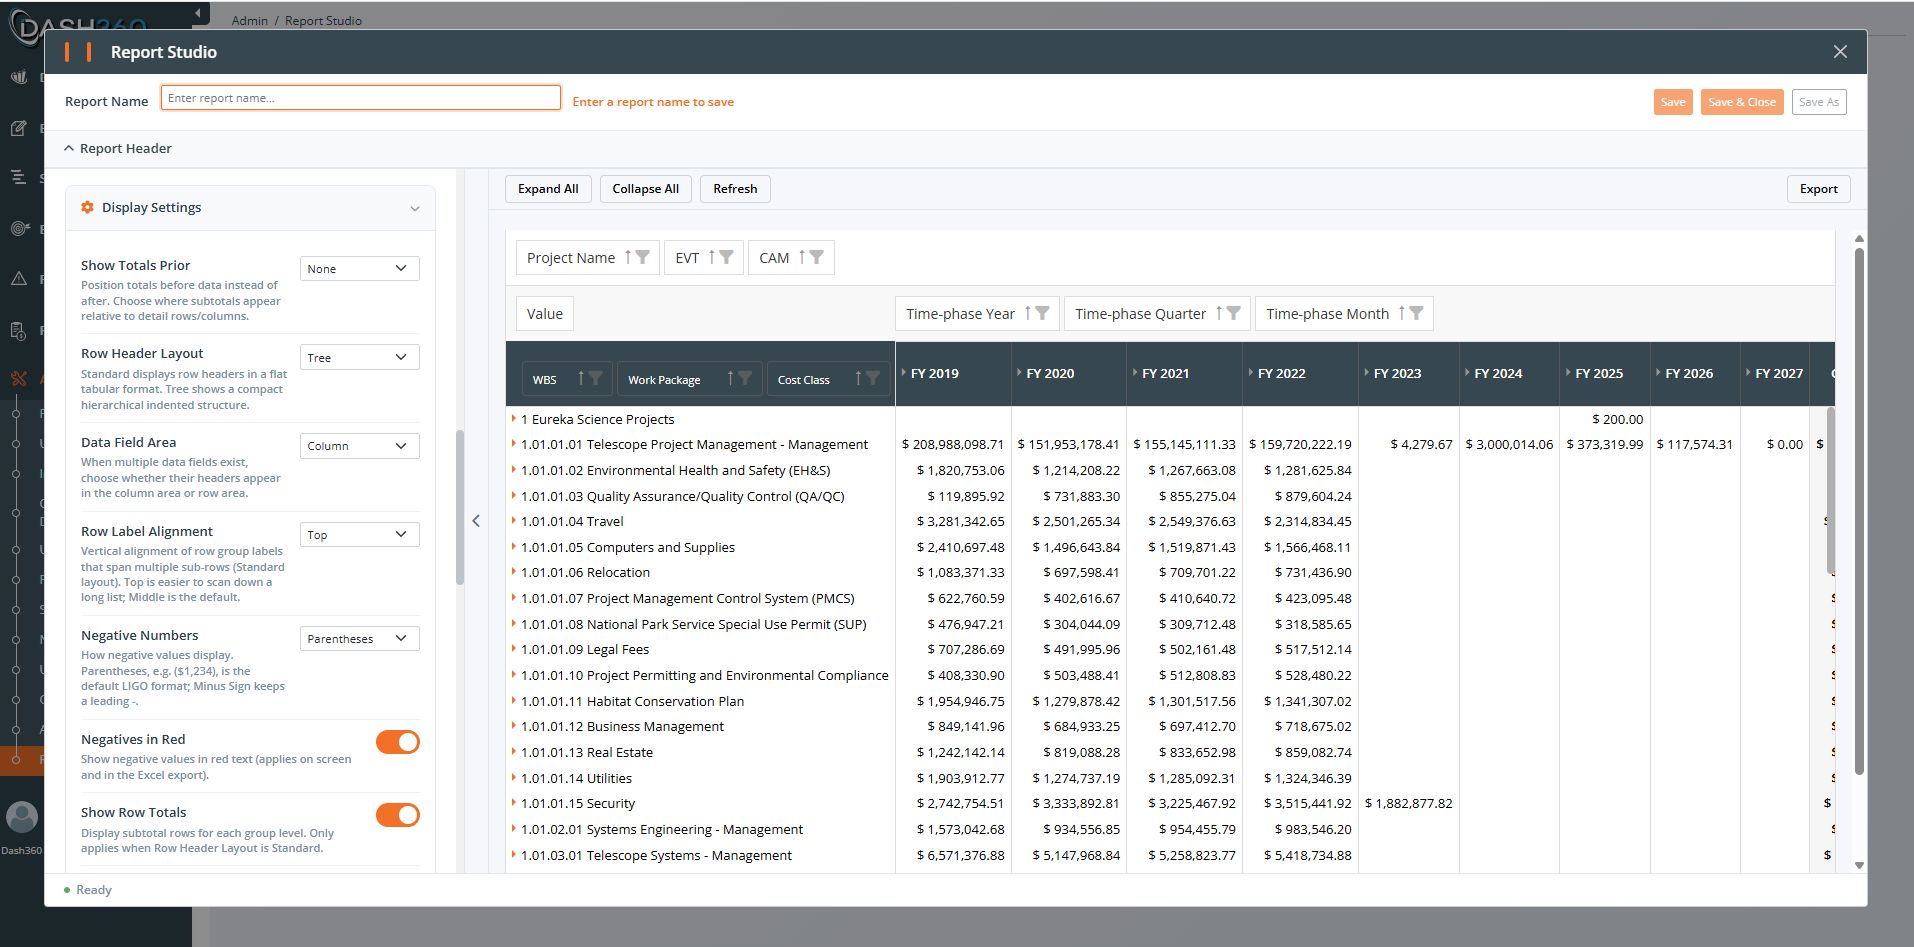
Performance: apply filters early
Like the Data Grid, the Pivot Grid runs on the server. Reduce the data it has to crunch:- Fewer Row and Column fields means a smaller cross-tab to compute.
- Expand sections on demand rather than expanding all at once on a large pivot.
- Results are cached for up to 30 minutes for the same projects, fields, and filters.
Pitfalls to avoid
Where to go next
Building Charts
Pie, bar, stacked, line, area, and trellis charts.
Calculated Field Cookbook
Ready-to-use formulas and how to fix wrong results.